AMD Radeon RX 6800 XT And RX 6800 OpenCL Performance Measured In Fresh Benchmark Leak
AMD provided some tantalizing benchmark results for its Radeon RX 6000 series during its launch event, though we have been around long enough to know that internal testing does not always tell the whole story. So, how do AMD's next-gen graphics card actually perform? The reviews will tell the final story. As a prelude, however, there are some leaked benchmark scores on Geekbench.
Before we go any further, the same disclaimer applies—leaked benchmarks do not always tell the whole story, and sometimes can be grossly inaccurate. There are just too many variables involved, and that is assuming the hardware listed is what it says it is. So there is your spoonful of salt. Now, let's get to the numbers, shall we?
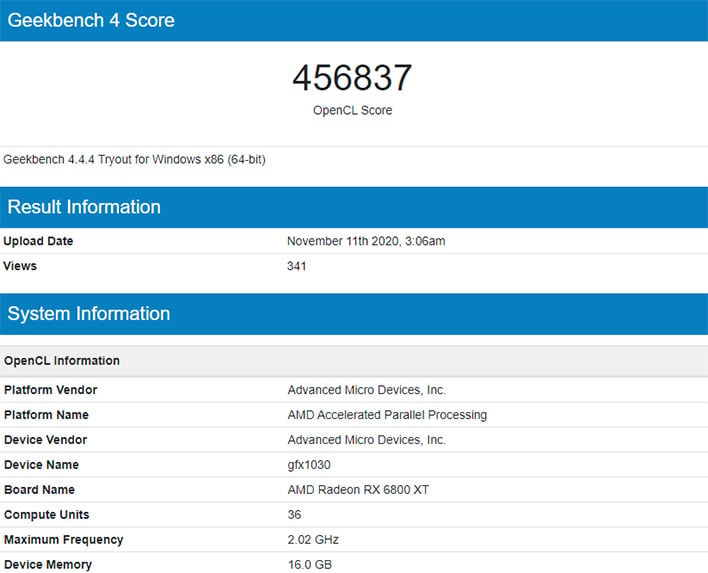
As spotted by Twitter user APISAK (who else?), both the Radeon RX 6800 XT and Radeon RX 6800 have made supposed cameos on Geekbench (version 4.4, though), with OpenCL scores. There are six scores in all, including four for the Radeon RX 6800 XT and two for the Radeon RX 6800. Here they are, in descending order...
- Radeon RX 6800 XT: 456,873
- Radeon RX 6800 XT: 413,121
- Radeon RX 6800 XT: 407,387
- Radeon RX 6800 XT: 392,643
- Radeon RX 6800: 347,137
- Radeon RX 6800: 356,337
The highest score was obtained on a testbed consisting of an ASUS ROG Crosshair VIII Hero motherboard, Ryzen 9 5950X CPU, and 32GB of RAM. All the rest appear to be from the same user, as the testbeds in each of those are the same—ASUS ROG Maximus XII Extreme motherboard, Core i9-10900K CPU, and 16GB of RAM.
Geekbench does not reveal the GPU clockspeeds in any of these runs, so who knows which ones were obtained at stock settings (if any) and which ones were obtained with an overclock (also if any). In any event, if we compare the highest scores from each card, the Radeon RX 6800 XT has a nearly 32 percent advantage over the Radeon RX 6800. However, if we limit the comparison to the same testbed, the difference between the two cards is 19 percent.
It gets a little tricky navigating Geekbench's OpenCL scores, but a quick hit on Google comes up with a recent GeForce RTX 3070 listing that scores 361,042, and a recent GeForce RTX 3080 listing that scores 470,743.
Doing some quick math, the highest Radeon RX 6800 XT scores is around 26.5 percent higher than the GeForce RTX 3070, while the GeForce RTX 3080 is around 3 percent higher.
Likewise, the GeForce RTX 3070 scored 4 percent higher than the Radeon RX 6800, and the GeForce RTX 3080 scored around 35.6 percent higher.
Again, do not put a whole lot stock in any of these numbers and comparisons. Instead, let them whet your appetite for when the full set of benchmarks get served next week.