Apple M1 Macs Choking On GIFs? There's An Apparent Memory Leak
There were earlier concerns about excessive wear on the permanently attached SSDs, and a new one popped up this week regarding memory usage. In this case, it’s with Acorn, a popular image editor developed by Gus Mueller for Macs. A user submitted that this one animated GIF that contained around 730 frames was causing weird memory readings on their M1 Mac.

Given that we have a few M1-based Macs in-house, we decided to do a little detective work to see what was going on. We grabbed the GIF and opened it on an M1 Mac mini and a 2018 Core i5 Mac mini. We were definitely able to reproduce the issue. You can see something pretty alarming in the macOS Activity Monitor:
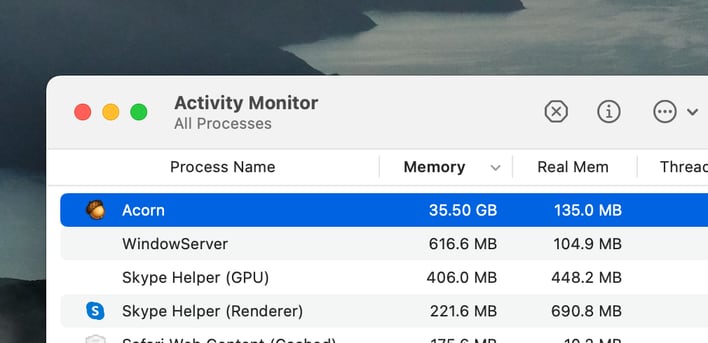
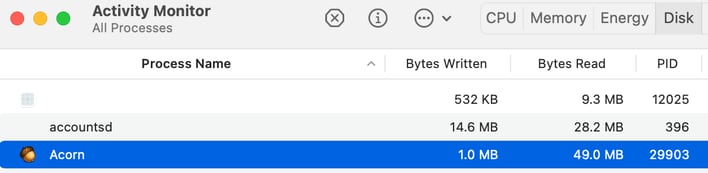
Do you see the 35.5 GB of memory allocated? That’s weird, right? Well, yes, it’s weird. However, is Acorn really getting all of that memory? Simply put, the answer is no. The Real Memory column is what’s being used by the app on the system. And better yet, it’s not thrashing our Mac’s SSD. Even with the file open, we’re not noticing any excessive disk activity while performing other tasks on the machine.
So, this doesn’t appear to be a big problem that should worry users. The issue, it seems, is with the macOS service IOAccelerator. The integrated GPU uses this process to handle input and output requests, like reading images from a disk and feeding them to the M1’s integrated GPU. It’s likely a driver-related memory leak. Incidentally, you can learn a lot about the GPU in your Mac by queuing ioreg and grabbing IOAccelerator in the terminal:
ioreg -r -d 1 -w 0 -c “IOAccelerator"
Incidentally, with this image open and displayed on the desktop, IOAccelerator says the GPU only uses 644 MB of system memory (the “2” is an identifier since it increments with each property listed), so it seems like it’s pretty benign. Here’s a portion of our Terminal output:

Finally, we should also point to Apple’s documentation on the topic of memory use. It describes the memory chart at the bottom of the Memory tab in Activity Monitor. The whole of macOS is using 11.6GB of the 16GB in the Mac, with 2.3GB dedicated to caching.

Mueller says in the thread that he created a bug report for IOAccelerator. It’s probably freaking out about all the frames in the GIF as it prepares to send it to the GPU. On an Intel Mac, it’s OK, which is why we think that it’s the driver and not the service itself. Apple does some very interesting caching and QoS tricks to keep Apple Silicon Macs feeling smooth, and this is probably one of them running amok, but it doesn’t appear to be causing any issues from what we can see.