Huge Intel Binning Test Reveals 13th Gen Raptor Lake CPU Model Overclocking King
If you know what you're doing and are willing to put in the time and research, overclocking is still a great way to squeeze out some added horsepower for essentially a free performance boost. You also have to be a bit lucky in playing the silicon lottery. To that end, an exhaustive roundup of Intel's 13th Gen Core CPUs highlights which Raptor Lake SKU offers the best overclocking potential.
The folks at Igor's Lab tested nearly 500 Raptor Lake CPUs spread across Intel's initial launch lineup, including the Core i9-13900K, Core i9-13900KF, Core i9-13700K, Core i7-13700KF, Core i5-13600K, and Core i5-13600K. All of those CPUs sport unlocked multipliers, as denoted by the "K" designation in the model number, while the "F" designation means Intel disabled the onboard graphics, otherwise known as the iGPU.
Testing Methodology And Results
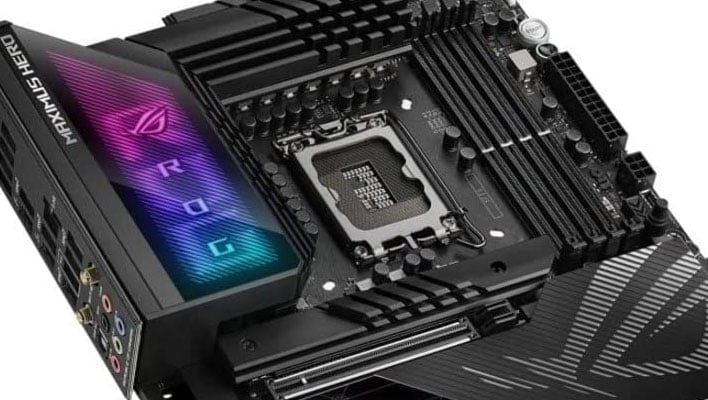
We can only imagine the massive time suck that would be involved in thoroughly testing the overclocking prowess of several hundred CPUs. Rather than go that route and perhaps finish when Lunar Lake lands out in the distance, Igor's Lab opted to employ the Silicon Prediction (SP) feature that's part of the ASUS ROG and Strix motherboard family. In this instance, they used an ASUS ROG Maximus Z790 Hero motherboard.
What this does is evaluate a processor's minimum voltage needed for each frequency on a voltage frequency curve. This is known as the V/F curve. Using that data, the motherboard crunches some numbers and spits out an SP value. The higher the value, the better the quality of the silicon, at least in theory. And of course higher quality silicon typically offers better overclocking performance (again, in theory).
It's not an exact science nor is it a true substitute for exhaustive hands-on testing of each individual CPU. But when you're dealing with around 480 processors, exhaustive testing could take a very long time—probably months rather than days or even weeks. Other caveats include improvements that might be introduced with future steppings, the specific motherboard used, BIOS updates, cooling, and so forth.
The site also disclaims that absolute SP values alone are not comparable between Core i9, Core i7, and Core i5 SKUs.
"The reason for this is the different V/F curves and stored value constants that ASUS uses to calculate the SP on their motherboards, per CPU type. An i5-13600K with SP 100 does not have the same clock potential as an i7-13700KF with SP 100 or an i9-13900K with SP 100," Igor's Lab points out.
That said, in the end it was the Core i9-13900KF that posted the best SP values, followed closely by the Core i9-13900K. After that, there was a bit of a drop off with the remaining four SKUs. Here's a look...

Data Source: Igor's Lab
The Core i9-13900KF posted an average score of 101.1 while the non-F model was right behind it at 99.6. It's also worth highlighting that the worst result of the Core i9-13900KF was 91, which beats the average of every lower-tiered CPU.
There's a significant drop off in scores starting with the Core i7. According to the above data, the Core i9-13900KF managed an average SP score that was around 21 percent higher than the Core i7-13700K. And compared to the worst of the bunch, the Core i5-13600K, it scored nearly 29 percent higher.
In addition to the caveats we already mentioned, we must also note the disparity in CPUs tested. There were around 2-3 times more Core i9 CPUs tested than each of the Core i7 and Core i5 parts. Who knows if testing more chips would have made a difference.
As laid out, the data suggests that the more you spend on a CPU, the better its overclocking potential within the Raptor Lake lineup. That says nothing of the value proposition, though. Over on Amazon, you're looking at $574 for the Core i9-13900KF, versus $319.91 for the Core i5-13600K. That's a $254.09 price difference between the two chips that had the highest and lowest average SP values, respectively, in this particular roundup.
Things get tricky when comparing SP values across the different product categories, though. Perhaps the bigger takeaway is that it doesn't appear opting for a cheaper KF model with disabled graphics has much impact in the way of overclocking potential, if taking these figures at face value.
All in all, we recommend treating this more as an interesting snapshot of SP values rather than a buying guide, whether you plan to overclock or not.