Ryzen 9 7950X3D CPU Trails 7950X In First Benchmarks But Don't Hit The Panic Button
After unveiling its lineup of Zen 4 processors with 3D V-cache at the Consumer Electronics Show in January, AMD more recently confirmed pricing across the board and when you'll actually be able to buy one of these chips, including the Ryzen 9 7950X3D—that flagship part carries a $699 MSRP and releases on February 28, 2023. That's only a week and a half away. To bide your time, some pre-release benchmarks are starting to appear on the web with some interesting results.
We'll get to the actual numbers and performance comparisons in a moment, but first let's recap the specs. The Ryzen 9 7950X3D is similar to the Ryzen 9 7950X, in that it shares the same 16-core/32-thread makeup, the same 5.7GHz max boost clock, and the same 1MB of L1 cache and 16MB of L2 cache. However, the Ryzen 9 7950X3D carries a slightly slower base clock (4.2GHz versus 4.5GHz) and wields twice as much L3 cache (128MB versus 64MB).
Based on what we saw with AMD's previous generation Ryzen 7 5800X3D, the top-of-the-line Ryzen 9 7950X3D should be a gaming powerhouse. Gaming is mainly where 3D V-cache comes into play, with benefits in other areas not as pronounced. Which brings us to the benchmark leaks, starting with Geekbench...
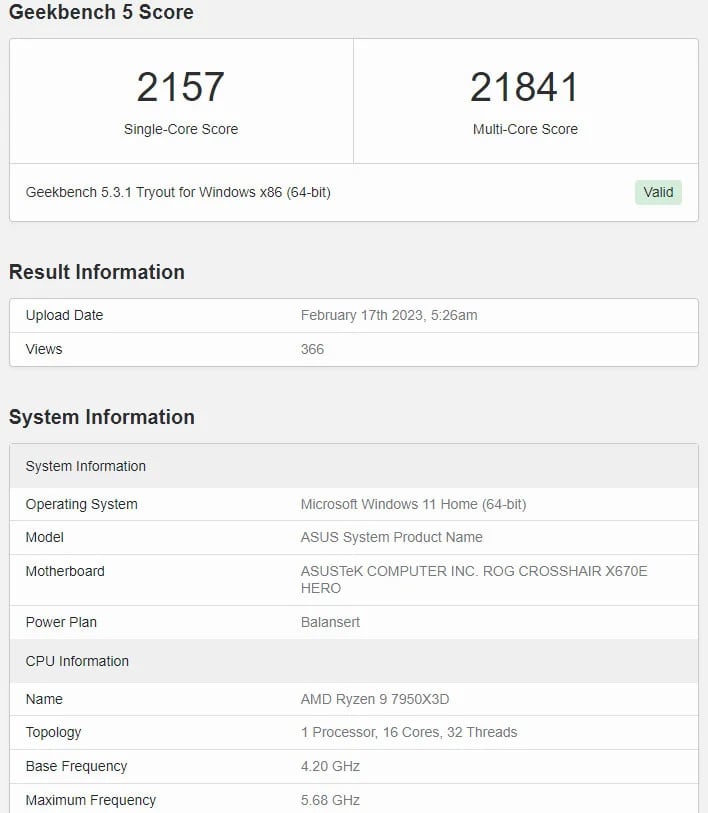
These figures were uploaded to Geekbench's database today. As you can see above, the Ryzen 9 7950X3D scored 2,157 in the single-core test and 21,841 in the multi-core test. These are not our figures, but we do have a collection of results from other processors we've tested. You can reference our latest numbers in our Core i9-13900K review, but here are some relevant comparisons.
- Core i9-13900K: 2,191 single, 23.330 multi
- Ryzen 9 7950X: 2,162 single, 21,956 multi
- **LEAKED Ryzen 9 7950X3D: 2,157 single, 21,841 multi
- Ryzen 9 7900X: 2,172 single, 18858 multi
The leaked single-threaded score is just slightly below the result we obtained with the regular Ryzen 9 7950X, and about 1.6 percent below Intel's Core i9-13900K. Same goes for the multi-threaded comparisons—the leaked Ryzen 9 7950X3D benchmark run scored around 0.5 percent below the result we obtained on the 7950X, and 6.4 percent below Intel's top CPU.
We've seen headlines touting double-digit multi-threaded performance disparities with the Ryzen 9 7950X3D versus the Ryzen 9 7950X, but we're more comfortable using our own data whenever possible. In this case, the leaked scores are just a tad slower, but slower nonetheless.
The other place the Ryzen 9 7950X3D make an early benchmark appearance is in Blender's database. There it posted a median score of 558.59. Looking at other entries in the database, that's 14 percent below the highest median score for a Ryzen 9 7950X (651.04), and around 7.4 percent below Intel's Core i9-13900KF (602.99).