3DMark WildLife Benchmark Shows iPhones Thrashing Androids But Apple Throttles Hard
The standard WildLife test is designed to give feedback on how a game performs over a short period of time. With mobile games, people typically play in brief spurts when they find some free time; be it on the bus, on the subway, or a quick battle royale session on your lunch break, but not always.
The 3DMark WildLife Stress Test, on the other hand, shows how a device performs over a longer stretch of time, and takes note of performance degradation that can crop up due to increased heat levels and throttling (which we'll get to a bit later in this article). As UL explains, "Instead of producing a single score, the main result from the stress test is a chart that shows you how the device’s performance changed during the test."
When running on Android devices or Windows PCs, WildLife uses the Vulkan API. On iOS devices (like the iPhone and iPad), WildLife uses Apple's Metal API.
3DMark WildLife Unlimited: Android Phones Vs iPhones - A One-Off Test Run
Given that we make heavy use of 3DMark benchmarks for our smartphone reviews, we decided to take a look at how some smartphones that we have in our lab (both new and old) stack up against each other. The results were somewhat surprising, but we caution you to reserve your opinion and final analysis until you've digested the next segment of our testing efforts here as well. Alas, without further ado...
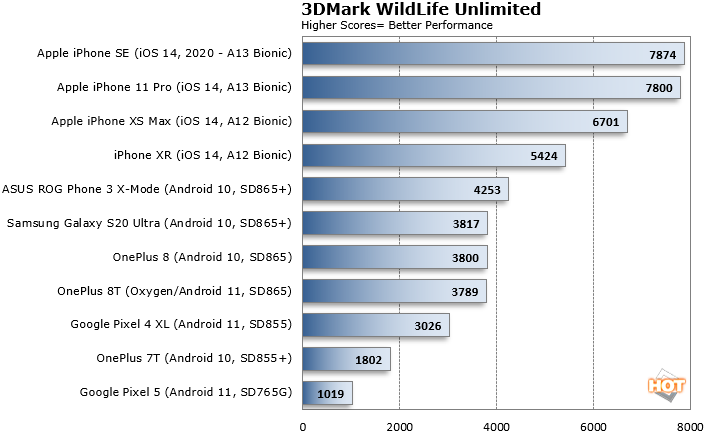
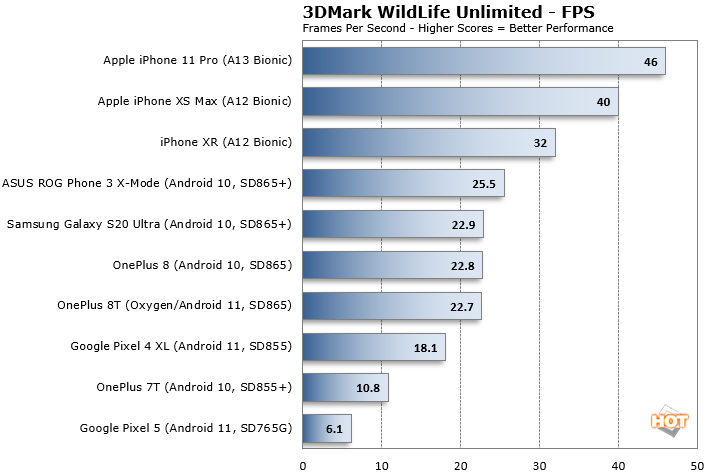
We decided to run WildLife Unlimited, which allows each device to run as fast as it can independent of the given refresh rate thanks to off-screen rendering; the standard WildLife test is capped by the device's refresh rate. What we can clearly see here is that the GPU in Apple's line of iPhones is an absolute performance monster, as it's easily able to dispatch its Android rivals in this short-burst benchmark.
What's remarkable is just how far the divide is between the iPhones and flagship Android devices. To put things in perspective, the iPhone XR, which was at the bottom rung of Apple's 2018 flagship smartphone lineup, put up a score of 5424, which is 42 percent faster than the OnePlus 8/8T. The iPhone XR’s performance was also 27 percent faster than the mighty ASUS ROG Phone 3 in X-Mode.
The iPhone 11 Pro, Apple's 2019 flagship device, really threw down the gauntlet with a score of 7800, more than doubling the performance that the OnePlus 8/OnePlus 8T could muster, while outpacing the ROG Phone 3 (X-Mode) by 87 percent. The spread could grow even wider with the iPhone 12 family, as recent leaked benchmarks show the A14 Bionic outpacing flagship Android phones by as much as 60 percent in single-threaded synthetic CPU tests. And Apple is claiming up to a 50 percent boost over its Android rivals in GPU benchmarks.
We've reached out to UL Benchmarks with a few questions to better understand the company's new benchmark, how it measures and weights performance, as well as how it utilizes these 3D graphics APIs.
But there's a LOT more to the picture here than just these performance runs...
WildLife Stress Test Unlimited - iPhone Thermal Performance Degradation Is Dramatic
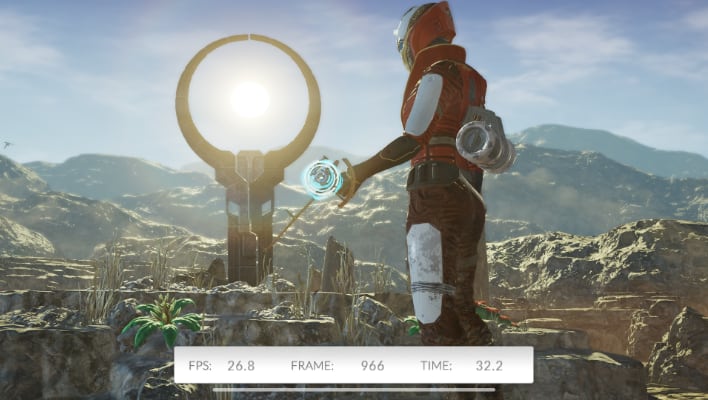
Where things really get interesting is with the WildLife Stress Test Unlimited, which we alluded to earlier. Since this test take a lot longer to run (20 minutes versus roughly a minute for WildLife Unlimited), we were paying close attention to any performance drop-offs, and this is where the iPhones showed their Achilles heel.
During its WildLife Stress Test Unlimited run, the iPhone 11 Pro put in a best loop score of 7945, which was of course recorded on its first run. However, once it completed that first run, performance dropped off considerably over the next 19 minutes until 20 runs were completed. By the end, exhausted from thermal throttling, the iPhone 11 Pro put in a final run score of 4106. That puts its benchmark stability at 51.7 percent.

Apple iPhone 11 Pro (L), OnePlus 8 (R) - Stark Contrast
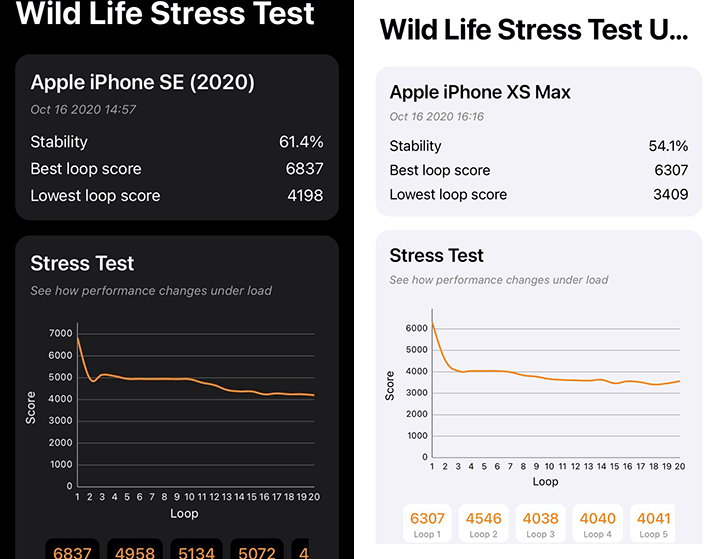
Apple iPhone SE & iPhone XS Max Throttle Hard As Well
Taking into account the steep drop-off in performance, the iPhone 11 Pro’s lowest benchmark run score was still higher than most of its Android rivals. However, the overachieving ASUS ROG Phone 3 in X-Mode was able to topple the iPhone 11 Pro's worst run and it should be noted that iPhone's performance levels off and stays down at the 4K mark after about the 13 minute mark. Speaking of the Android competition, the OnePlus 8/8T barely encountered any thermal throttling during the 20-minute exercise, posting a benchmark stability rating of over 99 percent. Regardless, the performance picture is completely different in the stress test, and our OnePlus 8 score on its fastest loop is much more on par with the iPhone 11 Pro after just a few runs. Of note is that each run is only about a minute in length, and people usually don't game for just a minute at a time obviously, but likely over several minutes at least.
Update 10/16/20, 9:16PM: iPhone SE (2020 - A13 Bionic) and iPhone XS Max (A12 Bionic) Stress Tests were added. Note that the sharp drop off continues, regardless of iPhone model. We will also note that we stress tested Samsung's Galaxy S20 Ultra (Snapdragon 865+) as well, with similar results to our OnePlus 8 results (top right). Almost no performance bleed off occurs with these Android phones and a 99+% stability rating is rendered by the WildLife Stress Test benchmark for the Snapdragon 865 models we tested.
It appears that Apple is targeting “peak” over “sustained” performance when it comes to the GPU in the A13 or A12 Bionic, while the Adreno 650 GPU in the Snapdragon 865 is a cool as a cucumber no matter the situation in the WildLife Stress Test. Whatever the case, this has been a rather eye-opening first look at 3DMark WildLife, and we’ll be interested in seeing how things pan out once we get an A14 Bionic-equipped Apple device in house, to see how far the lead for iPhones extends and or shrinks with continuous load. The rumored Qualcomm Snapdragon 875, which could be unveiled as early as December 1st, will have a lot of ground to makeup if it wants to vie for supremacy in this space, at least when it comes to the top benchmark scores, but perhaps not with respect to performance over time and thermal saturation.
So the question is, how do you game on your smartphone? Do you game for any more than say 10 minutes at a time? If so, make sure you consider how your phone holds up and not just what a one-time benchmark score might show. The picture for the iPhone 11 Pro here got a lot less rosy after a few halo runs.
If you'd like to try out 3DMark WildLife for yourself, you can grab it here for Android, iOS or Windows PCs.