18 Months Later: Origin's Genesis Desktop Revisited
Test Systems, Cinebench 11.5, 3DMark 11
We've almost entirely stuck to game tests because they're the most likely candidates for demonstrating whether or not the system has held its value. The Origin Genesis' CPU was comparatively cheap when the system shipped—a customer interested in highest-end CPU performance would've opted for an overclocked Core i7-980X rather than the budget-minded i7-920. The quad-GPU Radeon 5970s, on the other hand, were $1400 worth of video cards--easily the system's most-expensive components.
We've kept Cinebench R11.5 as our exception. While it only tests 3D rendering, it isolates CPU performance from the more system-centric tests like PCMark Vantage / PCMark 7, both of which can be significantly effected by SSD speeds.
We've compared against the Maingear Shift (when available), the Digital Storm Enix we reviewed a few months back, and we've borrowed numbers on the Radeon 6990. These tests are run on a Core i7 980X and are therefore reasonably comparable to our other included test results.
Cinebench 11.5 is the latest update to Maxon's 3D rendering benchmark suite and the third major iteration of the Cinebench series. As with R10, CB11.5 includes a single-threaded, multi-threaded, and OpenGL test. We've focused on the first two tests as part of our processor comparison; the OpenGL test is a GPU-specific benchmark and is meant to represent professional graphics performance.

We've kept Cinebench R11.5 as our exception. While it only tests 3D rendering, it isolates CPU performance from the more system-centric tests like PCMark Vantage / PCMark 7, both of which can be significantly effected by SSD speeds.
We've compared against the Maingear Shift (when available), the Digital Storm Enix we reviewed a few months back, and we've borrowed numbers on the Radeon 6990. These tests are run on a Core i7 980X and are therefore reasonably comparable to our other included test results.
|
|
|
|
Digital Storm Enix |
Origin Genesis Intel Core i7-920 @ 3.8GHz EVGA X58 SLI Classified 6GB Corsair DDR3-1600 2x ATI Radeon 5970 Crossfire 2TB WD Caviar Black RAID 0 Win 7 Home Premium x64 Price: $4,999 USD |
MAINGEAR SHIFT Intel Core I7-980X @4.2GHz Asus P6X58D 6GB Kingston DDR3-1600 RAM 2x GeForce GTX 480 SLI 1x Crucial C300 SSD Windows 7 Home Premium x64 Price: $ 5740.00 USD |
|
Cinebench 11.5 is the latest update to Maxon's 3D rendering benchmark suite and the third major iteration of the Cinebench series. As with R10, CB11.5 includes a single-threaded, multi-threaded, and OpenGL test. We've focused on the first two tests as part of our processor comparison; the OpenGL test is a GPU-specific benchmark and is meant to represent professional graphics performance.
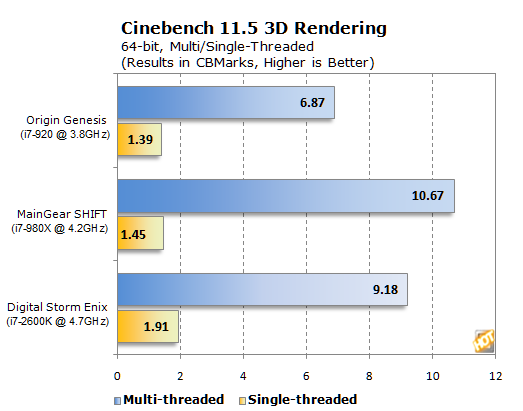
Results like these show how CPU performance has evolved in just the past 18 months. The Shift's Westmere processor wasn't all that much faster than the Genesis' chip in single-threaded workloads; the major difference between the two came courtesy of the Maingear system's additional CPU cores. The Enix, by comparison, is just a quad-core--but it's significantly faster in single-threaded rendering performance.
This is, however, a bit of a best-case scenario for Sandy Bridge as compared to the original Nehalem architecture--and the Enix is clocked some eight percent faster.
The 18-month old Radeon HD 5970s acquitted themselves quite well in 3DMark 11's Extreme test. One of the hallmarks of ATI's Cayman architecture is its improved tessellation--here, we see evidence that the quad-GPU 5970 configuration is an Alexandrian solution to the Gordian Knot that was the 5000-series tessellation performance. Granted, the 6990 is more efficient (two GPUs vs. four) and the Enix's dual GTX 580s take top ranking--but for two cards 18 months old, the results--16 percent off the GTX 580s--are solid.
This is, however, a bit of a best-case scenario for Sandy Bridge as compared to the original Nehalem architecture--and the Enix is clocked some eight percent faster.
|
|
|
|
|
The latest version of Futuremark's synthetic 3D gaming benchmark, 3DMark11, is specifically bound to Windows Vista and 7-based systems because it uses the advanced visual technologies that are only available with DirectX 11, which isn't available on previous versions of Windows. 3DMark11 isn't simply a port of 3DMark Vantage to DirectX 11, though. With this latest version of the benchmark, Futuremark has incorporated four new graphics tests, a physics tests, and a new combined test. We tested the graphics cards here with 3DMark11's Extreme preset option, which uses a resolution of 1920x1080 with 4x anti-aliasing and 16x anisotropic filtering. |


The 18-month old Radeon HD 5970s acquitted themselves quite well in 3DMark 11's Extreme test. One of the hallmarks of ATI's Cayman architecture is its improved tessellation--here, we see evidence that the quad-GPU 5970 configuration is an Alexandrian solution to the Gordian Knot that was the 5000-series tessellation performance. Granted, the 6990 is more efficient (two GPUs vs. four) and the Enix's dual GTX 580s take top ranking--but for two cards 18 months old, the results--16 percent off the GTX 580s--are solid.


