AMD Ryzen Threadripper 2920X And 2970WX Review: Lower Cost, Many Core Beasts
Ryzen Threadripper 2920X And 2970WX - Cinebench, POV-Ray, And Fluid Dynamics
Cinebench R15 is a combination CPU and OpenGL 3D rendering performance test based on Cinema 4D from Maxon. Cinema 4D is a 3D rendering and animation tool suite used by animation houses and producers like Sony Animation and many others. It's very demanding of system processor resources and can utilize any number of threads, which make is an excellent gauge of computational throughput. This is a multi-threaded, multi-processor aware benchmark that renders and animates 3D scenes and tracks the length of the entire process. The rate at which each test system was able to render the entire scene is represented in the graphs below.
|
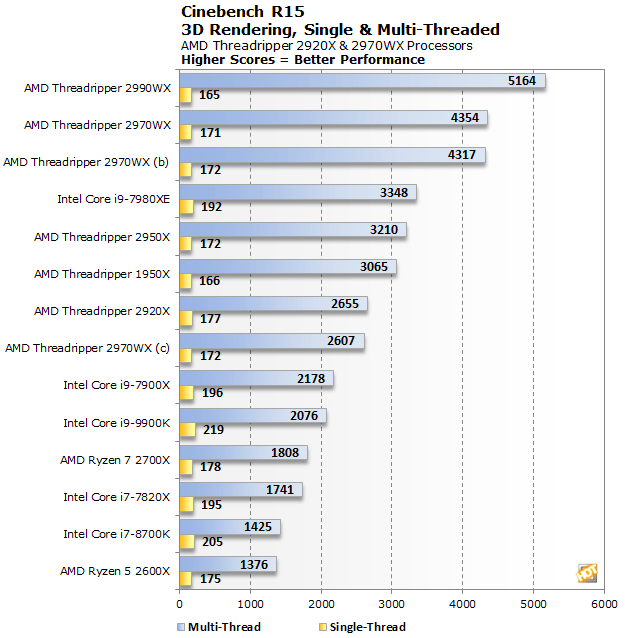
* Threadripper 2970WX (b) results = Dynamic Local Mode Enabled, (c) results = 1/2 core mode with UMA Memory
|
POV-Ray, or the Persistence of Vision Ray-Tracer, is an open source tool for creating realistically lit images. We tested with POV-Ray's standard 'one-CPU' and 'all-CPU' benchmarking tools on all of our test machines and recorded the scores reported for each. Results are measured in pixels-per-second throughput; higher scores equate to better performance.

* Threadripper 2970WX (b) results = Dynamic Local Mode Enabled, (c) results = 1/2 core mode with UMA Memory
Performance in POV-Ray mirrors Cinebench -- nothing comes close to touching the Threadripper 2970WX and 2990WX in the multi-threaded test. Intel still holds a clear advantage in single-threaded performance, however.
|
STARS Euler3d is a computational fluid dynamics benchmark which uses a CFD grid that contains 1.23 million tetrahedral elements and 223 thousand nodes. The benchmark executable advances a mach 0.50 Advisory Group for Aerospace Research, or AGARD, flow solution for an aeroelastic test wing. The benchmark score is reported as a CFD cycle frequency in Hertz.
This benchmark is multi-threaded, but is also dependent on platform bandwidth, and cache and memory latency, so the final results are not determined by compute performance alone. Cache sizes and memory bandwidth affect the score as well...

* Threadripper 2970WX (b) results = Dynamic Local Mode Enabled, (c) results = 1/2 core mode with UMA Memory
This benchmark is impacted by platform bandwidth, latency, and CPU compute resources. It did not play well with the Threadripper 2970WX, regardless of what mode we tested (we expected better scores in legacy compatibility mode, like we saw with the 2990WX). The 2920X fares better, but none of the AMD processors can catch the fastest Intel processors here.


