Radeon RX 6750 XT Review With MSI: Strong 1440p PC Gaming
AMD Radeon RX 6750 XT Review: Test Setup & Synthetic Benchmarks
Our Test System: AMD Ryzen Powered
| Hardware Used: AMD Ryzen 7 5800X w/ PBO2 (3.8 - 4.95 GHz, 8-Core) ASRock X570 Taichi (AMD X570 Chipset) 32GB G.SKILL DDR4-3800 CL16 1T No GDM Toshiba RD400 512GB Samsung SSD 980 Pro 2TB Crucial MX500 2TB Integrated Audio Integrated Network NVIDIA GeForce RTX 3070 Ti FE EVGA GeForce RTX 2080 SUPER XC BLACK EVGA GeForce RTX 3060 XC BLACK AMD Radeon RX 6700 XT MSI Radeon RX 6750 XT MECH AMD Radeon RX 6800 AMD Radeon RX 6800 XT |
Relevant Software: Windows 10 Pro x64 (21H1) AMD Radeon Software (22.5.2 Preview) NVIDIA GeForce Drivers v512.59 Benchmarks Used: 3DMark (Time Spy, Port Royal, DXR) VRMark Unigine Superposition PSO2: New Genesis Benchmark Total War: Warhammer III Forza Horizon 5 Shadow of the Tomb Raider Gears 5 Red Dead Redemption 2 Metro Exodus Enhanced Edition Cyberpunk 2077 |

The first of our synthetic benchmarks is the venerable 3DMark Time Spy. One of the first DirectX 12 benchmarks, it still has the capability to really put the hurt on systems, and it looks fantastic. The benchmark runs through a scene with extremely high-detail geometry, including the full benchmark scene for every previous version of 3DMark enclosed in glass boxes, like dioramas.
We tested using the default settings for the standard benchmark, as this class of video cards really isn't suited for Time Spy Extreme.
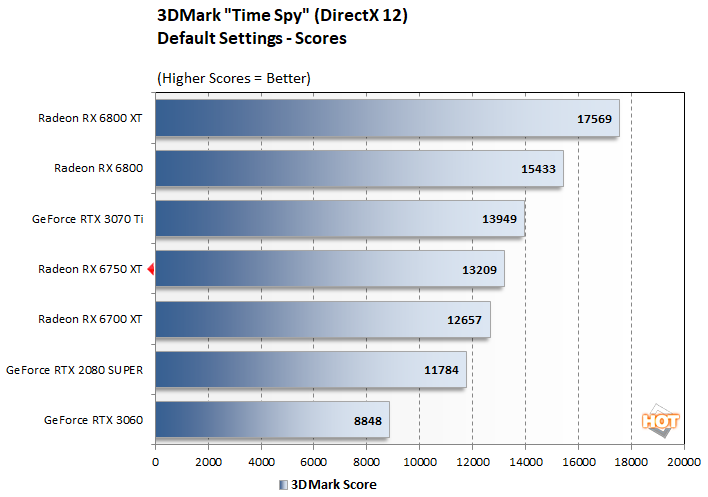
There really aren't any surprises here, and this in fact more or less sets the pace for the rest of our testing. The new hot-clocked Navi 22 card comes in just ahead of the original recipe, and is a step behind the RTX 3070 Ti. Meanwhile, the Navi 21 cards are out ahead of the pack, and the slower GeForces fall behind. It isn't always this way, though...
UL 3DMark Port Royal Tests

The gorgeous Port Royal benchmark tests hybrid rendering performance, RTX-style. The scene of a futuristic airport or spaceport in a cloud city is rendered using a mixture of traditional rasterization and ray-tracing, and it still looks stunning. As usual, we ran the test using the default settings.
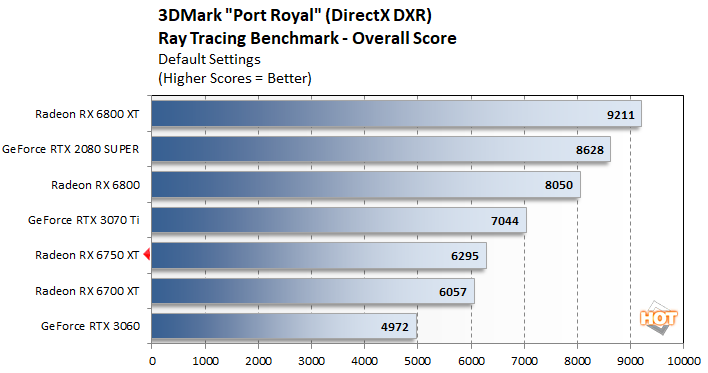
Surprisingly, the old GeForce RTX 2080 SUPER climbs nearly to the top of the pack here, bested only by the powerful Radeon RX 6800 XT. This probably has something to do with the fact that Turing was the only GPU architecture capable of ray-tracing when this benchmark came out, meaning that this benchmark is likely particularly well-optimized for those cards.
That outlier aside, we see the earlier pattern repeat itself: the RX 6750 XT is wedged comfortably between the original RX 6700 XT and the GeForce RTX 3070 Ti. We'd say it's probably right on target for direct competition with the standard RTX 3070 here.
UL 3DMark DX Feature Test

DXR is DirectX Ray-tracing, or one of the two APIs that Windows games can use to make use of hardware-accelerated ray-tracing features (the other being a component of Vulkan.) 3DMark's "feature tests" are specialized tests intended to hammer a certain part of a GPU or CPU to test its performance with regard to a specific feature; in this case, it's ray-tracing.
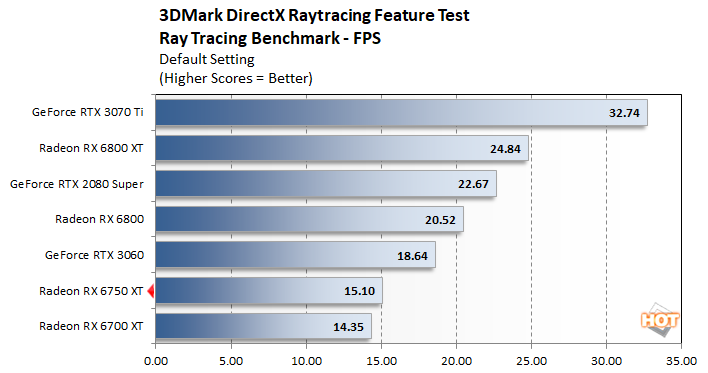
It's no secret that NVIDIA's Ampere GPU architecture is prime for ray-tracing, and so it's no surprise that the GeForce RTX 3070 Ti takes the top spot in this test by a long shot. It's also not particularly surprising that the GeForce RTX 3060 hops out ahead of the new 6750 XT here. Numerically, this is basically just a confirmation that this GPU isn't really any different from the last; if you mainly want to play RT games, there's additional performance to be had with an Ampere-based GeForce.
UL VRMark Blue Room
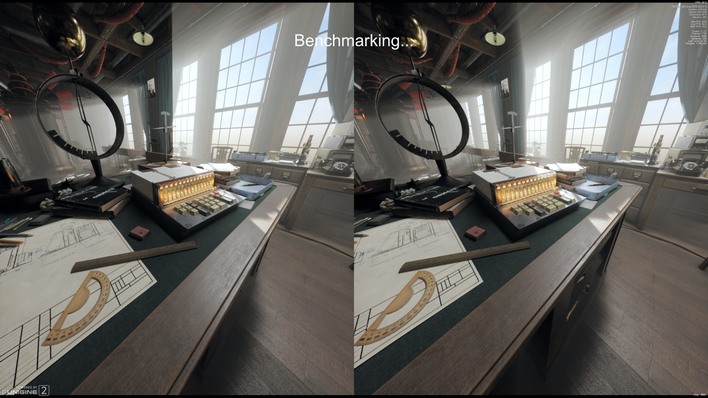
VRMark's Blue Room test is its most demanding test, running in a massive 5120×2880 resolution. It's also a 3D projection, which means that some portion of the work has to be done twice for each eye. Despite that, this test doesn't make use of ray-tracing, which means that all of our GPUs more or less handle it with aplomb.
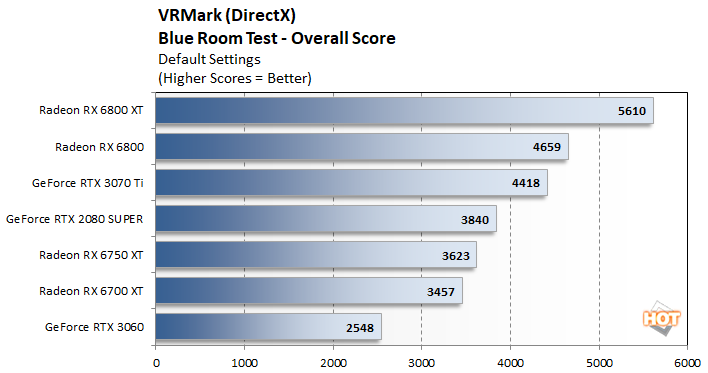
It's a little surprising to see the older Turing GeForce jump out ahead of the mainstream Radeons here, but not unbelievable; it has a wide 256-bit memory bus and numerous VR-specific driver optimizations. Those optimizations aren't enough to overcome the massive fillrate advantage that the bigger Radeons enjoy, though. The RX 6750 XT continues to be just one step ahead of the RX 6700 XT.
Unigine Superposition VR Ready Test
Unigine's SuperPosition benchmark has been around since 2017, and it's one of the better tests of DirectX 11 performance. While new games might be focusing on DirectX 12 and Vulkan, there are still a whole lot of fantastic DirectX 11 games out there just waiting to be played. We use the VR Ready test in "VR Future" mode to put the heaviest load on the graphics cards.

Unsurprisingly, the chart looks almost exactly like the last one, although the Navi 22 cards creep up on the older, bigger GeForce quite a bit even though this is a DirectX 11 benchmark.
Synthetics are all well and good, but how does it do in games? Well, let's find out!


