How We Configured Our Test Systems: We tested the graphics cards represented in this article on a MSI X570 Godlike motherboard, equipped with a Ryzen 9 5950X and 16GB of G.SKILL DDR4 RAM clocked at 3,200MHz. The first thing we did when configuring the test system was enter the UEFI and set all values to their "high performance" defaults, then we disabled any integrated peripherals that wouldn't be put to use. The memory's clock was dialed in to its optimal performance settings using its XMP profile and the solid state drive was then formatted and Windows 10 Professional x64 was installed and fully updated. When the Windows installation was complete, we installed all of the drivers, games, applications and benchmark tools necessary to complete our tests. For all of the standard tests, the Radeon RX 6000 series cards were tested using their "Balanced" performance profile. "Rage" mode was enabled for a sampling of tests present in the overclocking section of this article, however. The new Radeons were also tested with and without Smart Access Memory enabled, in an attempt to paint the most complete picture of performance.
|

|
| HotHardware's Test System |
| Intel Core i9 Powered |
|
Hardware Used:
AMD Ryzen 9 5950X
(3.4GHz - 4.9GHz, 16-Core)
MSI X570 Godlike (AMD X570 Chipset)
16GB G.SKILL DDR4-3200
Samsung SSD 970 EVO
Integrated Audio
Integrated Network
NVIDIA GeForce RTX 3070 FE
NVIDIA GeForce RTX 3080 FE
NVIDIA GeForce RTX 2080 Ti FE
AMD Radeon RX 5700 XT
AMD Radeon RX 6800
AMD Radeon RX 6800 XT
AMD Radeon RX 6900 XT
|
Relevant Software:
Windows 10 Pro x64 (v2004)
AMD Radeon Software v20.8.3
NVIDIA GeForce Drivers v457.30
Benchmarks Used:
IndigoBench v4
LuxMark v4_alpha0
SiSoft SANDRA 2020
VRMark
3DMark (Time Spy, Fire Strike, Port Royal, DXR)
Unigine Superposition
Crytek Neon Noir
Metro Exodus
Red Dead Redemption 2
Gears Tactics
F1 2020
FarCry: New Dawn |
|
|
| SiSoft SANDRA 2020 |
| Scientific Analysis And Image Processing OpenCL Performance Tests |
|
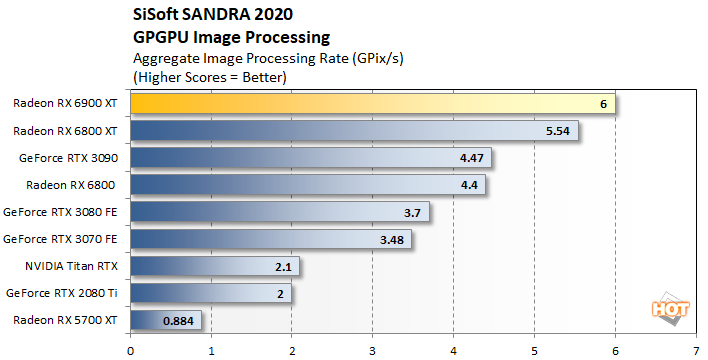
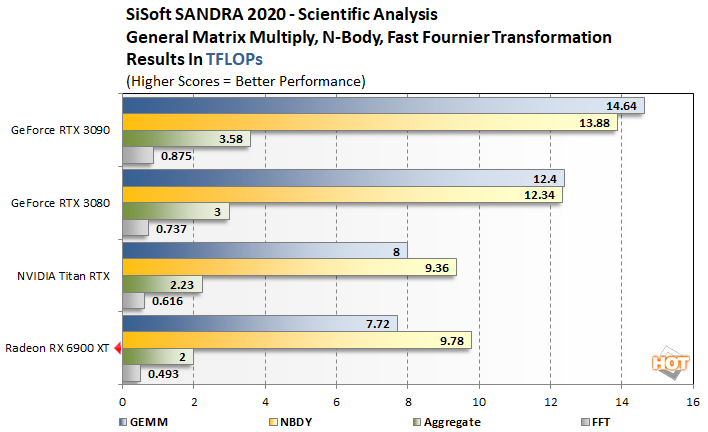
SANDRA's GPGPU Image Processing benchmark runs through an array of filters on its reference data and offers up an aggregate score, derived from a multitude of individual results. The Scientific Analysis benchmark runs though an array of General Matrix Multiply (GEMM), N-Body Simulations (NBDY), and Fast Fourier Transformation ops and reports the overall speed in FLOPs. CUDA and OpenCL code paths are available in these tests, but we used OpenCL on all cards to keep the playing field level. Previously, using the CUDA code path with NVIDIA GPUs resulted in better performance, but OpenCL actually outperforms it in these tests now...
The Radeon RX 6900 XT led the pack in SANDRA's GPGPU image processing benchmark, besting the Radeon RX 6800 XT by a little over 8% and the
GeForce RTX 3090 by over 33%.
The scales tipped in favor of NVIDIA in SANDRA's Scientific Analysis tests, however. Here, the AMD Radeon RX 6900 XT trails the GeForce RTX 30-series cards across the board -- by large margins. It only manages to pull ahead of the Titan RTX in the N-Body simulation, but even then, it's my the slimmest of margins.
|
|
LuxMark v4.0_alpha0 |
|
OpenCL Benchmark |
|
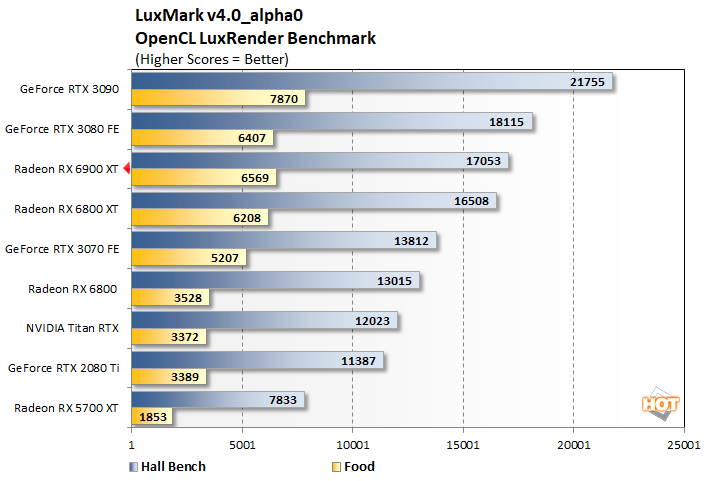
LuxMark is a cross-platform, OpenCL-accelerated 3D rendering benchmark. It's a tool based on the open source LuxRender physically-based spectral rendering engine, which accurately models the transportation of light and supports high dynamic range. LuxRender features a number of material types to allow rendering of photo-realistic and artistic scenes. LuxRender is free software, licensed under the GPL, that offers plugins for packages like Blender, Maya, Cinema 4D and 3DS Max.
The Radeon RX 6900 XT's performance in LuxMark 4 was a bit of a mixed bag. AMD's latest flagship was able to outpace the
GeForce RTX 3080 when rendering the more complex Food model, but it trailed slightly with the Hall Bench model. The GeForce RTX 3090 finished well ahead at the top.
|
|
IndigoBench |
|
GPU Rendering Performance |
|
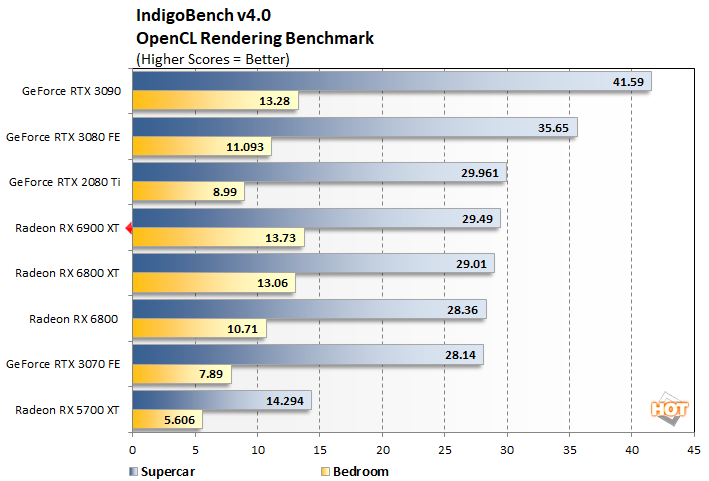
IndigoBench is based on Indigo 4's advanced rendering engine, which uses physically-based material models, ray tracing, and spectral color throughout, and offers both CPU and GPU rendering modes for its two built-in models. The standalone benchmark is available for Windows, MacOS, and Linux and outputs results in M/Samples per second.
The Radeon RX 6900 XT's performance was mixed in IndigoBench as well. Here, the Radeon RX 6900 XT puts up the best score of the bunch with the more complex Bedroom model, but it ends up trailing the GeForce RTX 2080 Ti with the Supercar model, not to mention the higher-end
NVIDIA GPUs, which jumped out to some big leads.
|
|
| Unigine Superposition |
| Pseudo-DirectX / OpenGL Gaming |
|
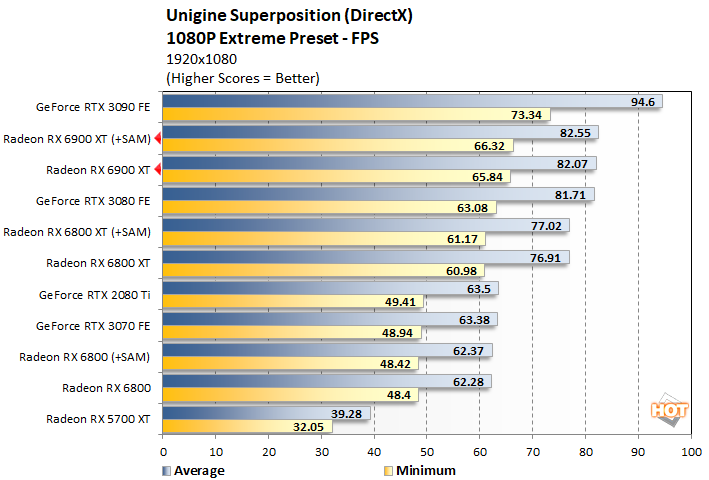
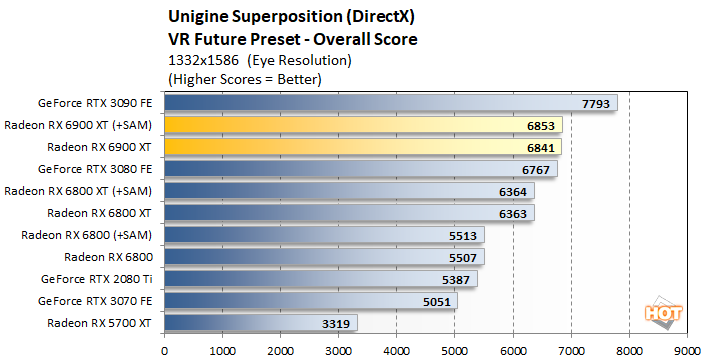
Superposition is a relatively new benchmark from Unigine, powered by the UNIGINE 2 Engine. It offers an array of benchmark modes, targeting gaming workloads as well as
VR, with both DirectX and OpenGL code paths. There is an extreme hardware stability test built-in as well. Unigine Superposition uses the developer’s unique SSRTGI (Screen-Space Ray-Traced Global Illumination) dynamic lighting technology, along with high quality textures and models, to produce some stunning visuals. We ran Superposition in two modes using the DirectX code path – 1080p Extreme and VR Future -- to compare the performance of all of the graphics cards featured here.
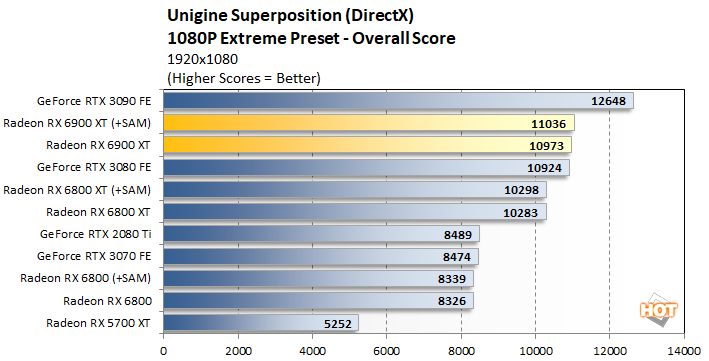
Unigine Superposition
Unigine Superposition's 1080P Extreme test had the new Radeon RX 6900 XT outpacing every other card in the stack, except for the more expensive GeForce RTX 3090. The GeForce RTX 3080 is right on its heals, though.
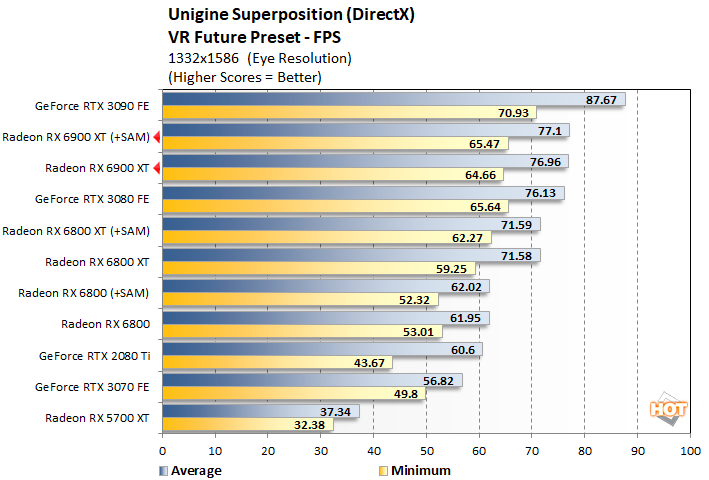
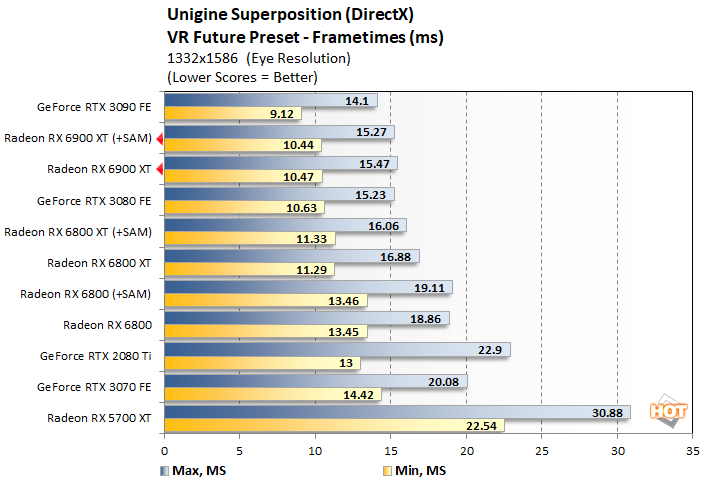
Superposition's VR Future benchmark tells the same story. Here, the
Radeon RX 6900 XT once again edges out the GeForce RTX 3080, but it couldn't catch the GeForce RTX 3090.
|
| UL VRMark |
|
Testing Rift And Vive Readiness |
|
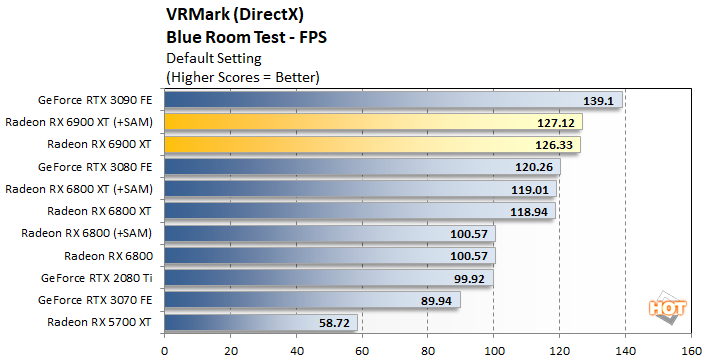
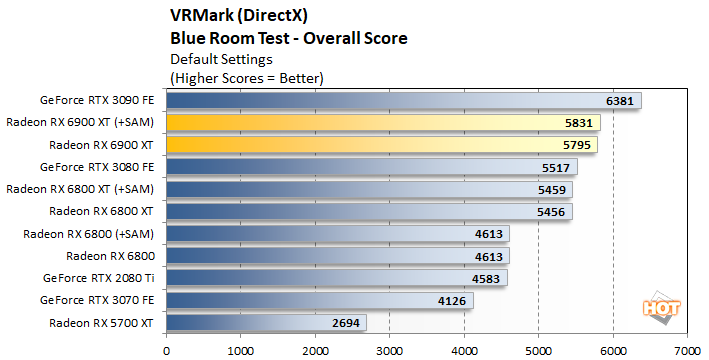
UL's VRMark is designed to test a PC’s readiness for the HTC Vive and Oculus Rift virtual reality headsets. The benchmark does not, however, require that one of the headsets is attached to the PC to run and it uses an in-house graphics engine and content to ensure comparable results between different platforms. We ran the
"Blue Room" VRMark test at defaults settings here, which is currently the most taxing test offered by the tool.
Futuremark VRMark
Radeon RX 6900 XT VRMark Details
Starting to see pattern yet? Our results with VRMark look very much like Unigine's VR Future benchmark above. AMD's Radeon RX 6900 XT clearly outpaces the GeForce RTX 3080 (and everything below it), but the GeForce RTX 3090 remains the king of the hill.
|
| UL 3DMark Time Spy |
|
Direct X 12 Performance |
|
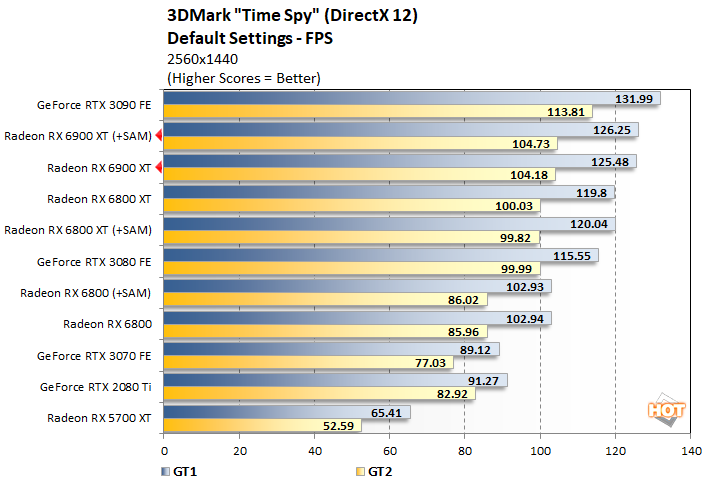
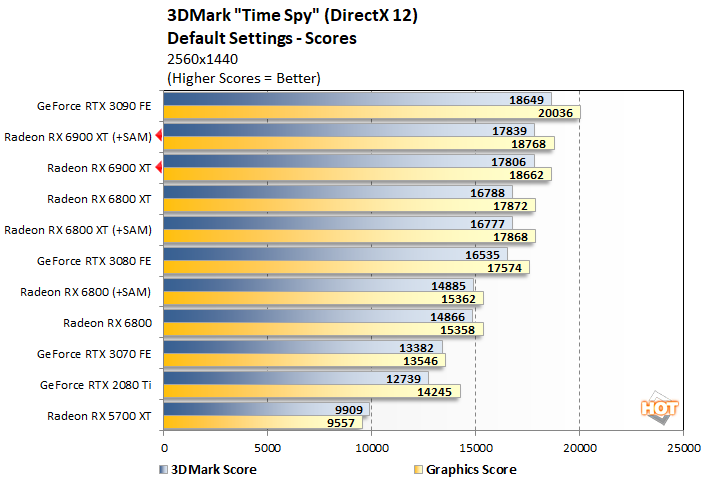
In the DX12-based 3DMark Tme Spy benchmark, the Radeon RX 6900 XT once again outpaces every other card we tested, save for the pricier
GeForce RTX 3090.
|
|
| UL 3DMark Fire Strike |
| Synthetic DirectX Gaming |
|
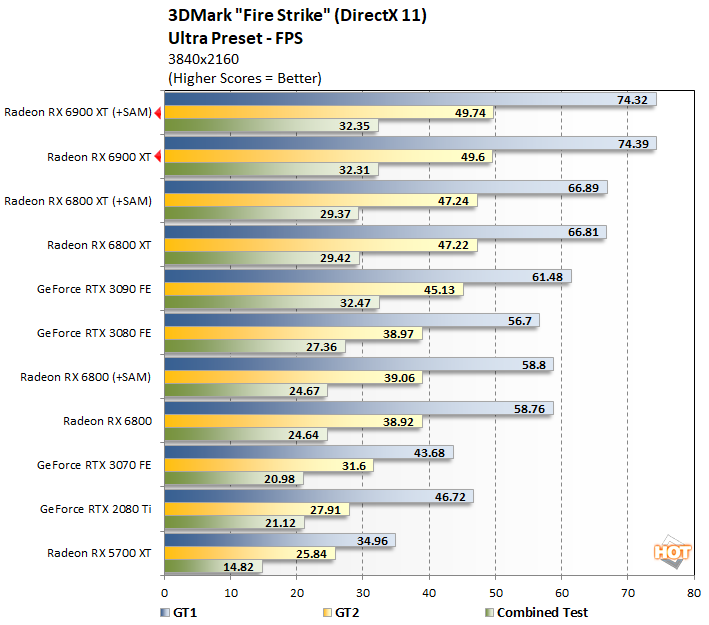
3DMark Fire Strike has multiple benchmark modes: Normal mode runs at 1920x1080, Extreme mode targets 2560x1440, and Ultra mode runs at a 4K resolution. GPU target frame buffer utilization for normal mode is 1GB and the benchmark uses tessellation, ambient occlusion, volume illumination, and a medium-quality depth of field filter. The more taxing Extreme mode targets 1.5GB of frame buffer memory and increases detail levels across the board. Ultra mode is explicitly designed for high-end and CrossFire / SLI systems and cranks up the quality even further. GT 1 focuses on geometry and illumination, with over 100 shadow casting spot lights, 140 non-shadow casting point lights, and 3.9 million vertices calculated for tessellation per frame. GT2 emphasizes particles and GPU simulations.
3DMark Fire Strike
Radeon RX 6900 XT Fire Strike Ultra Details
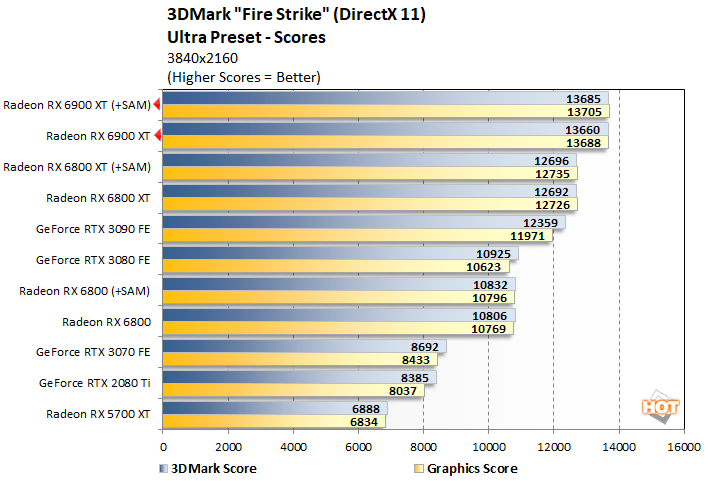
Score one for AMD. In the DX11-based Fire Strike Ultra 4K benchmark, the Radeon RX 6900 XT outperformed every other card we tested, including the GeForce RTX 3090.
|
| UL 3DMark Port Royal |
| DXR Ray Tracing Benchmark |
|
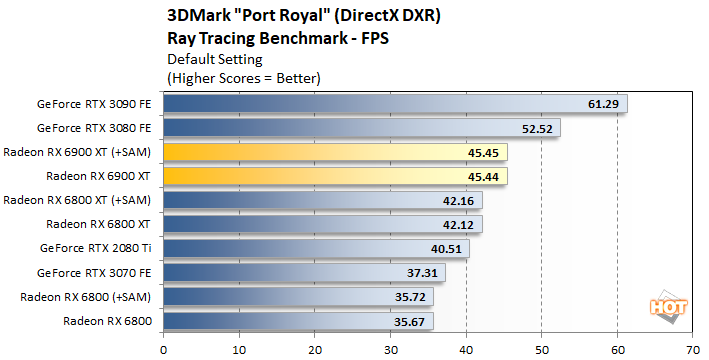
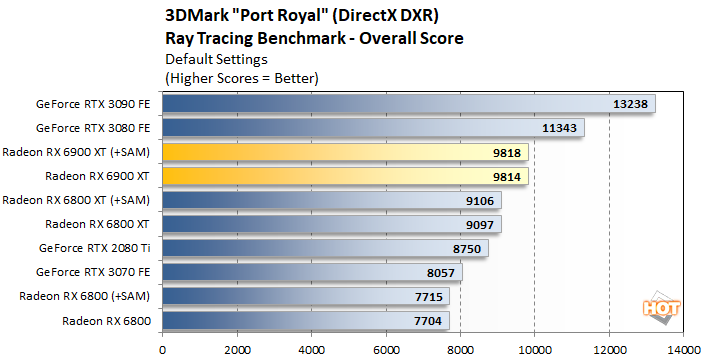
Port Royal was released earlier this year as an update to UL’s popular 3DMark suite. It is designed to test real-time ray tracing performance of graphics cards that support Microsoft DirectX Raytracing, or DXR. Although DXR is technically compatible with all DX12-class GPUs, the graphics card must have drivers that enable DXR.
3DMark Port Royal
Radeon RX 6900 XT Port Royal Details
3DMark's Port Royal benchmark is a stark reminder that the Radeon RX 6000 series is AMD's first foray into real-time, hardware accelerated
ray tracing. While the Radeon RX 6900 XT is clearly able to outrun the GeForce RTX 2080 Ti and RTX 3070, the high-end
GeForce RTX 30-series cards are significantly faster.
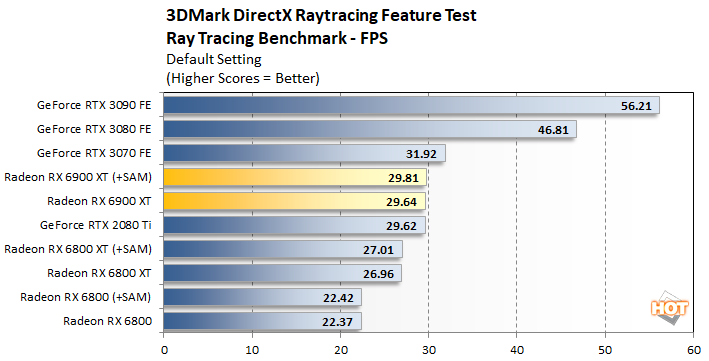
We also experimented with the recently released 3DMark DirectX Ray Tracing Feature test, but the results were even less kind to AMD...
Radeon RX 6900 XT DXR Feature Test Details
The Radeon RX 6900 XT just barely edges out the GeForce RTX 2080 Ti here, but ends up trailing the GeForce RTX 3070 (which has a 50% lower MSRP). The GeForce RTX 3080 and RTX 3090 simply crushed the Radeon RX 6900 XT here.