AMD Ryzen 3000XT Processors Reviewed: Zen 2 Turbocharged
AMD Ryzen 3000XT Series Review: System Level Benchmarks

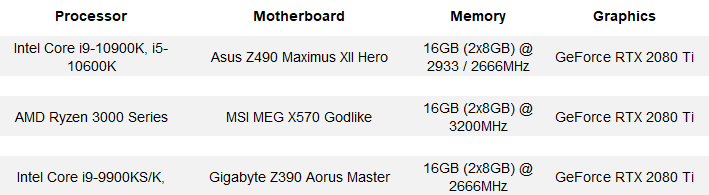
When the Windows installation was complete, we installed all of the drivers necessary for our components, disabled Auto-Updating and Windows Defender, and installed all of our benchmarking software. When that process was done, we performed a disk clean-up, cleared any temp and prefetch data, and optimized all of the SSDs using Windows' built-in utility. Finally, we enabled Windows Focus Assist to minimize any potential interruptions and let the systems reach an idle state before invoking a test.
|
|
In the GeekBench tests, we're stressing only the CPU cores in a system (not the graphics card or GPU), with both single and multi-threaded workloads. The tests are comprised of encryption processing, image compression, HTML5 parsing, physics calculations and other general purpose compute processing workloads.
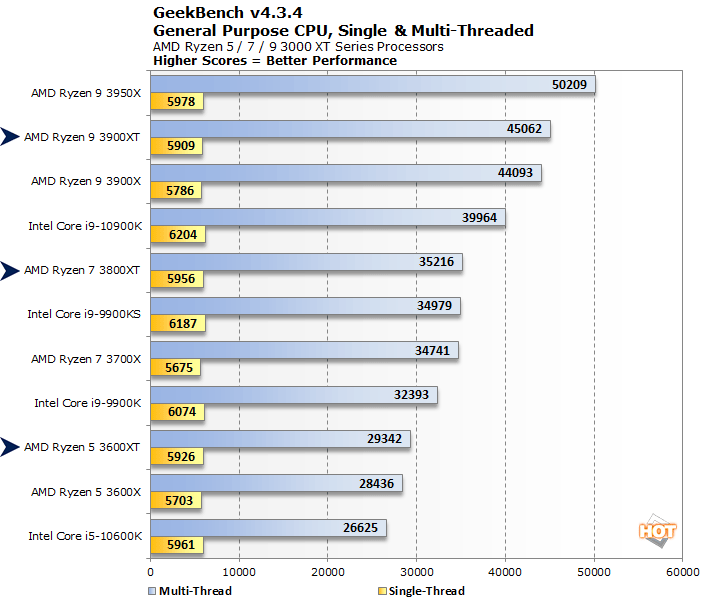
GeekBench didn't reveal any surprises. All three of the Ryzen 3000XT series processors exhibited nice single-thread performance uplifts, to the tune of 2 - 4%, which puts them close to Intel's 10th-Gen processors in this particular test (single-thread performance is much tighter with some other benchmarks). The multi-threaded benchmark shows increased performance across the board as well, but the deltas are ever so slightly smaller and fall in the 2% - 3% range.
|
Next up we have some full-system testing with PCMark. We're reporting all test results from the PCMark 10 benchmark suite, including the Essentials, Productivity, Digital Content Creation and and total PCMark score. The Essentials test covers workloads like web browsing, video conferencing and app start-up times, while Productivity tests everyday office apps from spreadsheets to word processing. Finally, the Digital Content Creation test evaluates performance of a machine with respect to photo and video editing, as well as rendering and visualization.
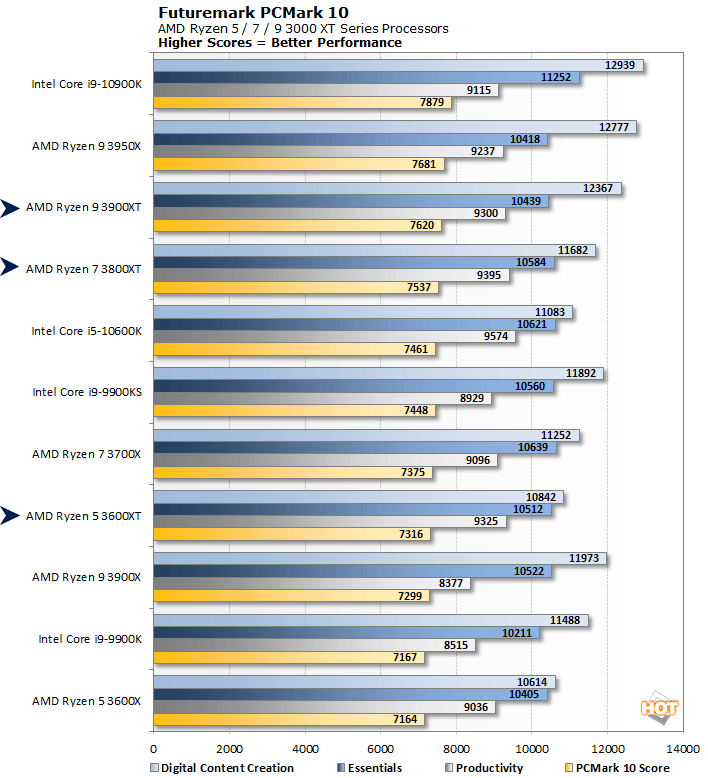
All of the platforms we tested offer somewhat similar overall performance according to PCMark, with less than 10% separating the fastest and slowest systems in terms of their overall score. Still, the new Ryzen 3000XT series processors inch past their counterparts and end up closer to the top, with the Ryzen 3900XT pressing on the Ryzen 9 3950X and Intel Core i9-10900K.
|
Y-Cruncher is a multi-core-capable tool that calculates the value of pi to a specified number of digits. In this case, we ran the tool on all threads and had the application calculate the value of pi to 1 billion digits. The values below are the time required to perform the calculation expressed in seconds. As a result, lower values indicate better performance.
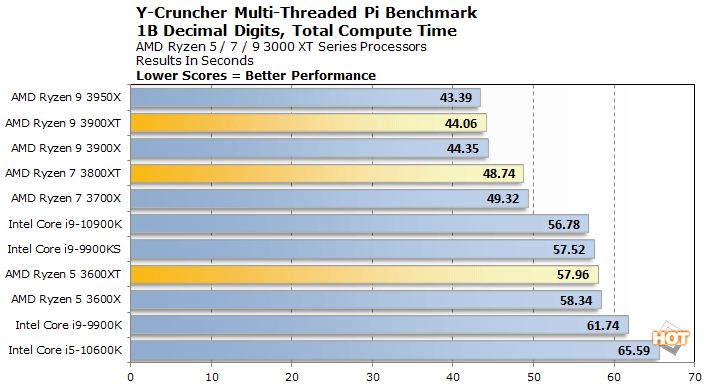
The Ryzen 3000XT series processors once again outran their "non-XT" branded counterparts, and technically notched up another set of victories, but we're talking about some tiny performance differences with this taxing, multi-threaded test.
|
STARS Euler3d is a computational fluid dynamics benchmark which uses a CFD grid that contains 1.23 million tetrahedral elements and 223 thousand nodes. The benchmark executable advances a mach 0.50 Advisory Group for Aerospace Research, or AGARD, flow solution for an aeroelastic test wing. The benchmark score is reported as a CFD cycle frequency in Hertz.
This benchmark is multi-threaded, but is also dependent on platform bandwidth, and cache and memory latency, so the final results are not determined by compute performance alone. Cache sizes and memory bandwidth affect the score as well...
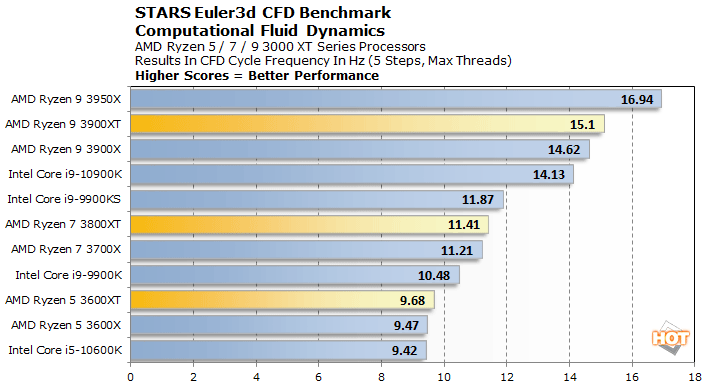
We saw more of the same with the STARS Euler CFD benchmark. The AMD Ryzen 3000 XT series processors offered slightly more performance than their predecessors.


