AMD Ryzen 9 5950X And 5900X CPU Review: Zen 3 Dominates
AMD Ryzen 9 5950X And 5900X Review: System Level Benchmarks

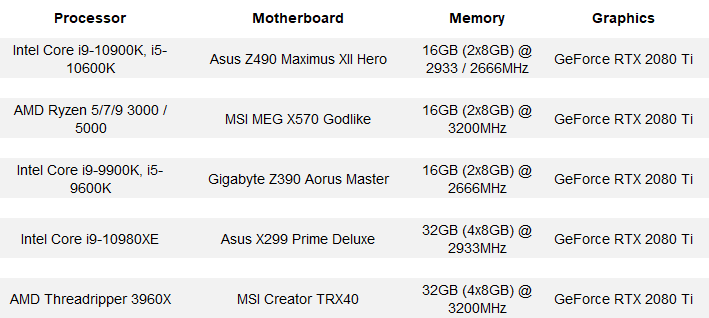
When the Windows installation was complete, we installed all of the drivers necessary for our components, disabled Auto-Updating and Windows Defender, and installed all of our benchmarking software. When that process was done, we performed a disk clean-up, cleared any temp and prefetch data, and optimized all of the SSDs using Windows' built-in utility. Finally, we enabled Windows Focus Assist to minimize any potential interruptions and let the systems reach an idle state before invoking a test.
|
|
We began our testing with the latest version of SiSoftware's SANDRA 2020, the System ANalyzer, Diagnostic and Reporting Assistant. We ran four of the built-in sub-system tests that partially comprise the suite with the Core i9-9900KS (CPU Arithmetic, Multimedia, Cache and Memory, and Memory Bandwidth). All of the scores reported below were taken with the CPU running at its default settings, with 16GB of DDR4 RAM running at 3,200MHz, in dual-channel mode, on the MSI MEG X570 Godlike motherboard.


| AMD Ryzen 9 5900X Processor Arithmetic |
AMD Ryzen 9 5900X Multi-Media |


| AMD Ryzen 9 5900X Memory Bandwidth |
AMD Ryzen 9 5900X Cache And Memory |


| AMD Ryzen 9 5950X Processor Arithmetic |
AMD Ryzen 9 5950X Multi-Media |


| AMD Ryzen 9 5950X Memory Bandwidth |
AMD Ryzen 9 5950X Cache And Memory |
|
In the GeekBench tests, we're stressing only the CPU cores in a system (not the graphics card or GPU), with both single and multi-threaded workloads. The tests are comprised of encryption processing, image compression, HTML5 parsing, physics calculations and other general purpose compute processing workloads.
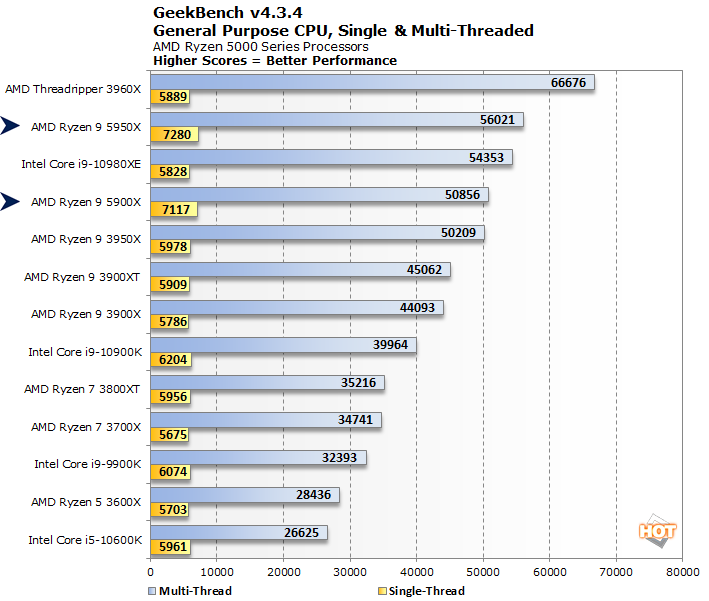
The Ryzen 9 5900X and 5950X rocked the GeekBench CPU benchmark. In this test, AMD's new flagship processors for its mainstream socket AM4 platform offer up the strongest single-thread performance by far, with excellent multithread performance as well. AMD Ryzen 5000 multithread scaling is so good, the 12-core Ryzen 9 5900X nearly catches the 18-core Core i9-10980XE, while the 16-core 5950X actually surpasses it.
|
Next up we have some full-system testing with PCMark. We're reporting all test results from the PCMark 10 benchmark suite, including the Essentials, Productivity, Digital Content Creation and and total PCMark score. The Essentials test covers workloads like web browsing, video conferencing and app start-up times, while Productivity tests everyday office apps from spreadsheets to word processing. Finally, the Digital Content Creation test evaluates performance of a machine with respect to photo and video editing, as well as rendering and visualization.
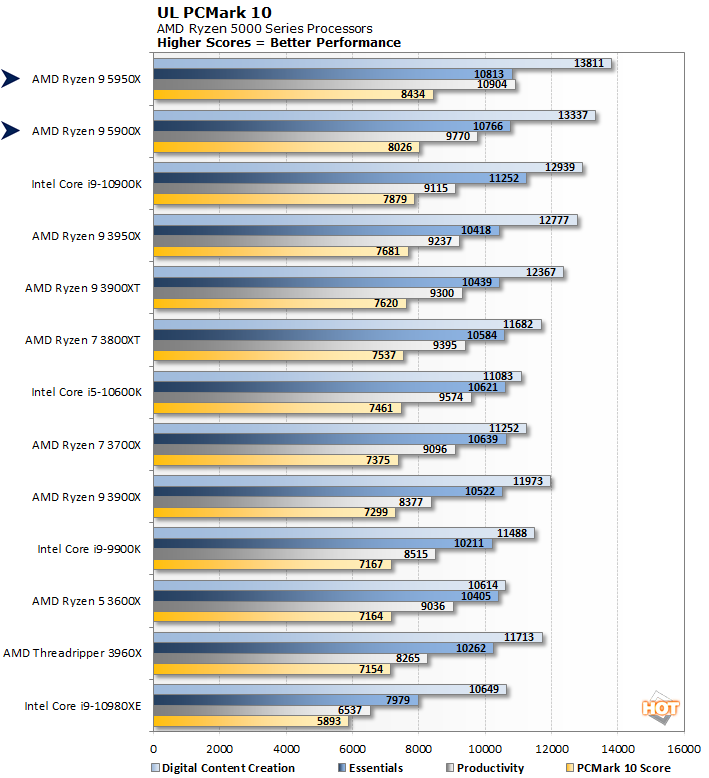
All of the platforms tested here offer more than enough oomph for PCMark 10's workloads. Regardless, the Ryzen 9 5900X and 5950X still put up impressive numbers, finishing at the top of the stack, ahead of all of the other platforms we tested.
|
Y-Cruncher is a multi-core-capable tool that calculates the value of pi to a specified number of digits. In this case, we ran the tool on all threads and had the application calculate the value of pi to 1 billion digits. The values below are the time required to perform the calculation expressed in seconds. As a result, lower values indicate better performance.
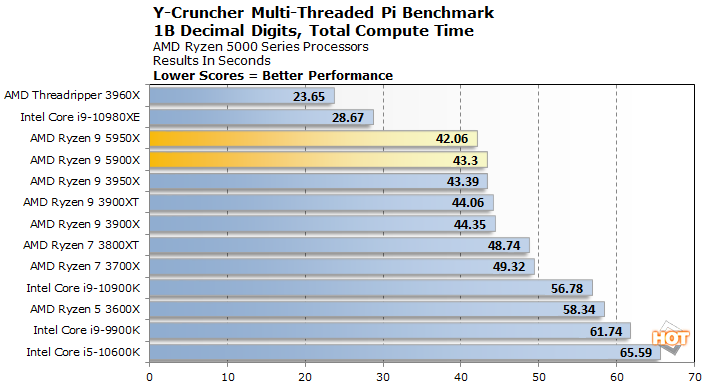
The High-End Desktop (HEDT) Threadripper and Extreme Edition Intel Core platforms offer significantly more memory bandwidth and end up in front here, but the Ryzen 9 5900X and 5950X managed to outpace all of the mainstream platforms yet again. The margins separating the top-end parts were relatively small, though.
|
STARS Euler3d is a computational fluid dynamics benchmark which uses a CFD grid that contains 1.23 million tetrahedral elements and 223 thousand nodes. The benchmark executable advances a mach 0.50 Advisory Group for Aerospace Research, or AGARD, flow solution for an aeroelastic test wing. The benchmark score is reported as a CFD cycle frequency in Hertz.
This benchmark is multi-threaded, but is also dependent on platform bandwidth, and cache and memory latency, so the final results are not determined by compute performance alone. Cache sizes and memory bandwidth affect the score as well...
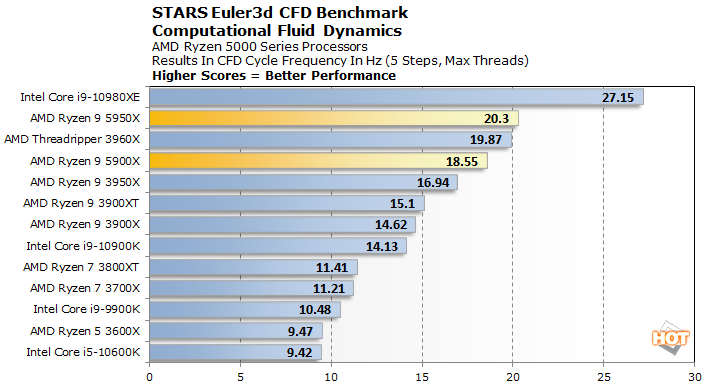
This particular benchmark favors Intel's monolithic design and the Core i9-10980XE's quad-channel memory gives it a boost as well. A such, Intel's current flagship HEDT processor comes out on top, but the Ryzen 9 5900X and 5950X fall in just behind it, sandwiching the 3rd Gen Threadripper and outgunning all of the other mainstream processors.
|
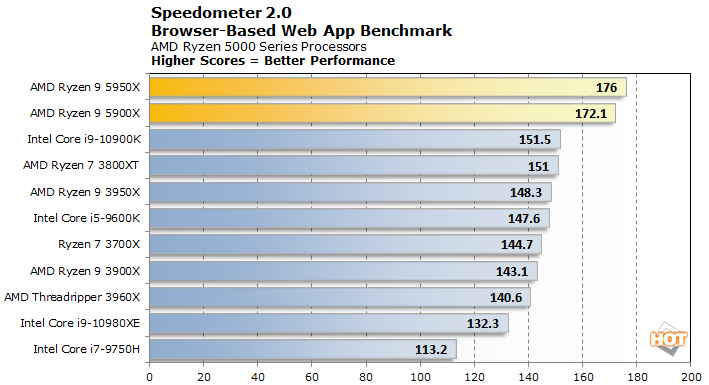
Next up, we have some numbers from the Speedometer 2.0 test available at browserbench.org. The Speedometer Benchmark Suite uses a wide array of latency and throughput benchmarks to evaluate web application performance, and all of the results are tabulated into a final score. The benchmark measures performance of an array of browser-based technologies used on modern, rich web applications. Scores in this benchmark are an indicator of the performance users would see when browsing and running advanced web apps.
All of the systems were tested using the latest version of Microsoft's Edge browser, with default browser settings, on a clean install of Windows 10 Professional x64.