Crucial BX300 3D MLC SSD Review: Affordable, Durable, Solid State Storage
Crucial BX300 SSD - Test Setup, IOMeter, Compression
Our Test Methodologies: Under each test condition, the Solid State Drives tested here were installed as secondary volumes in our testbed, with a separate drive used for the OS and benchmark installations. Out testbed's motherboard was updated with the latest BIOS available at the time of publication and AHCI (or RAID) mode was enabled.
The SSDs were secure erased prior to testing, and left blank without partitions for some tests, while others required them to be partitioned and formatted, as is the case with our ATTO, PCMark, SANDRA, and CrystalDiskMark benchmark tests. Windows firewall, automatic updates and screen savers were all disabled before testing. In all test runs, we rebooted the system, ensured all temp and prefetch data was purged, waited several minutes for drive activity to settle and for the system to reach an idle state before invoking a test.
|
| Processor - Motherboard - Video Card - Memory - Audio - Storage - |
Intel Core i7-7700K Asus Z270 Deluxe (Z270 Chipset, AHCI Enabled) Intel HD 620 16GB Corsair DDR4-2666 Integrated on board Corsair Force GT (OS Drive) Intel SSD 545s Samsung SSD 850 EVO OCZ Trion 150 Crucial BX300 WD Blue 3D SanDisk Ultra 3D |
OS - Chipset Drivers - DirectX - Video Drivers - Benchmarks - |
Windows 10 Pro x64 Intel 10.1.19, iRST 14.5.0.1081 DirectX 12 Intel HD 15.40.3.4248 IOMeter 1.1.0 RC HD Tune v5.60 ATTO v3.05 AS SSD CrystalDiskMark v3.0.3 x64 PCMark 7 SiSoftware Sandra |
|
In the following tables, we're showing two sets of access patterns; our custom Workstation pattern, with an 8K transfer size, 80% reads (20% writes) and 80% random (20% sequential) access and a 4K access pattern with a 4K transfer size, comprised of 67% reads (34% writes) and 100% random access.
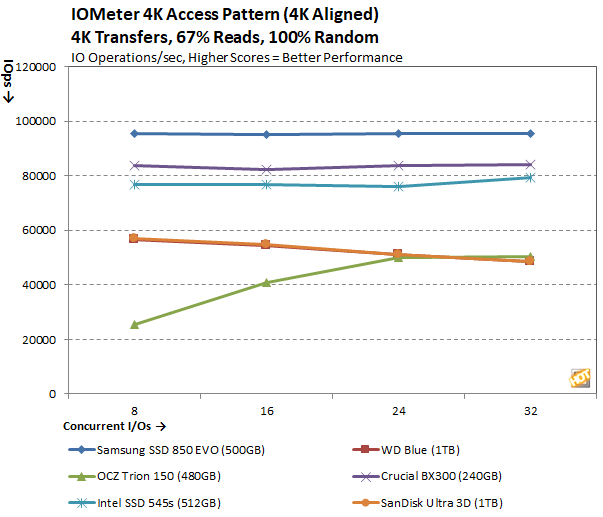

The relatively low-capacity 240GB Crucial BX300 drive we tested performed well here. Depending on the access pattern, the Crucial BX300 put up numbers on par with or better than the recently released Intel 545s.

|


