Dell G5 15 SE Laptop Review: All-AMD Gaming With SmartShift
Dell G5 15 SE: Web and Productivity Benchmarks

|
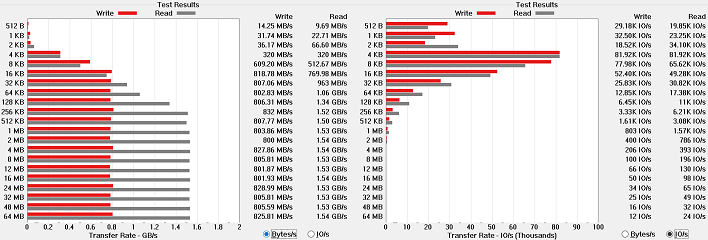
The drive in the G5 15 SE is a 512 GB SK Hynix BC501, and as we'll see later on this one turns out to be in the compact M.2 2242 format. That's a PCI-Express 3.0 NVMe M.2 drive rated for 1,600 MB per second for sequential reads and 860 MB per second for sequential writes. We can see that the drive hits those theoretical marks at around the 256 KB block size for reads. Writes max out sooner, at around 32 KB per block.
On the IOPS side, the drive doesn't really attain its rating of 200,000 IOPS at 4 KB, but the queue depth here is low. That 4 KB mark is important because that's the smallest writeable block on an NTFS-formatted drive. IOPS results drop off after that, because larger operations require more total bytes written, and as a result they eat into the available bandwidth. The curve is pretty normal, and since this isn't an SSD review it's important to note that the drive is definitely adequate for its task and move on.
|
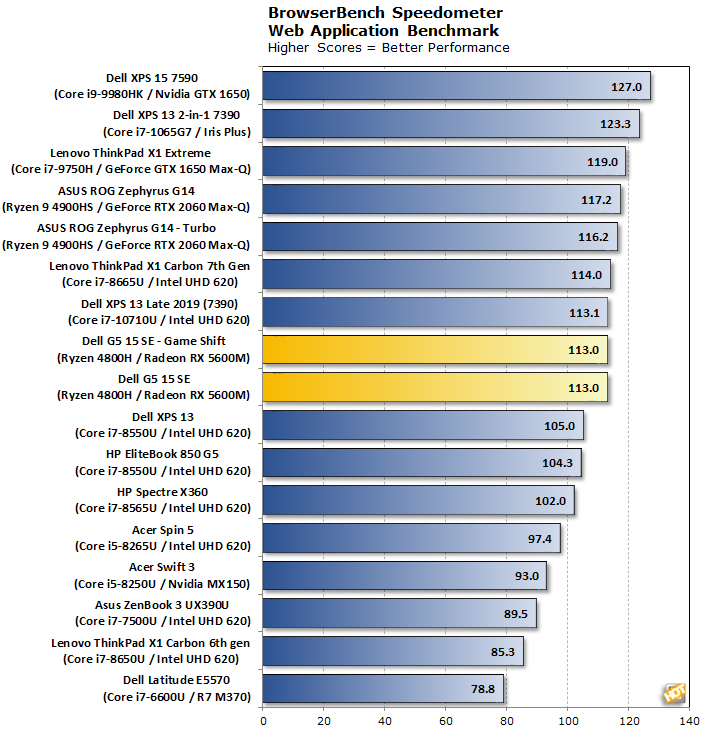
Right out of the gate, we see really solid performance from the G5 15 SE. The score is measured in runs per minute, in which the web app creates and then completes a to-do list, and most of the machines here are doing this in well under a second. With that in mind, just about every system here should feel pretty snappy online, and the Dell system is certainly no exception.
It seems Game Shift doesn't help web browsing tasks, as the two settings turn in identical scores. Since most browser benchmarks, including Speedometer, are burst-oriented tasks that stress just a couple of hardware threads, that's not a surprise. We'll keep an eye on that moving forward, though.
|
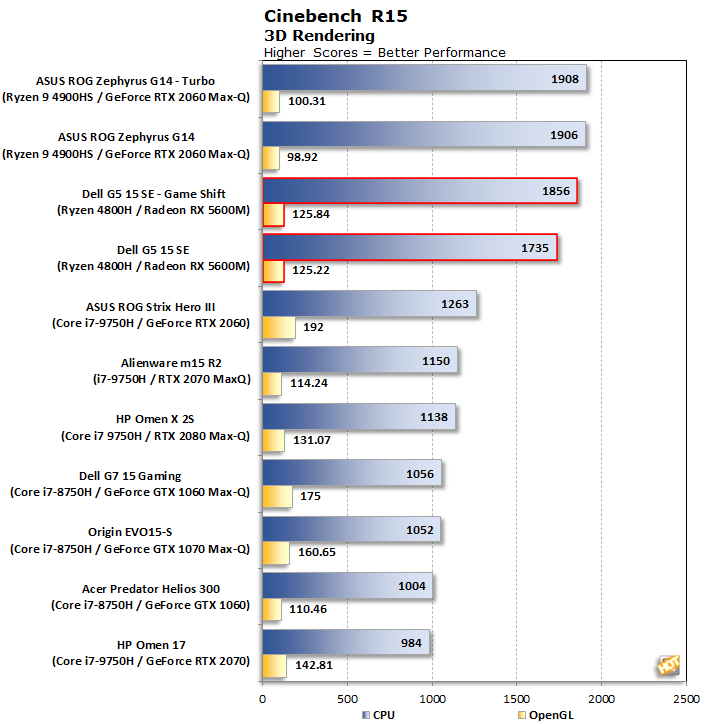
In the older Cinebench test, we sort our graphs by CPU score, so the Dell G5 15 SE rockets up towards the top of the chart. The only systems to best our test subject have the slightly faster Ryzen 9 4900HS. Here we start to see the benefit of Game Shift on the CPU side. The amped-up cooling and aggressive power plan really closes the gap between the Ryzen 7 4800H and Ryzen 9 4900H.
On the OpenGL side of things, the Dell G5 15 SE is actually towards the bottom of the pack. Every system here has some form of discrete graphics solution. We can see there's a lot of variance on this test, however, as the Radeon RX 5600M is both 7% faster than the GeForce RTX 2070 Max-Q in the Alienware m15 R2 and yet somehow trails a GeForce 1060 Max-Q in the Dell G7 15. Much of this probably has more to do with driver differences of a given system than the GPU itself. Game Boost didn't really do any good here, as the difference of 0.6 fps is well within a margin of error.
The latest version of Maxon's rendering benchmark, Cinebench R20, takes longer to complete, so this is a better test of a notebook's cooling system. This release also drops the OpenGL test, making Cinebench a pure CPU benchmark this time. We tested both single-threaded and multi-threaded performance here.
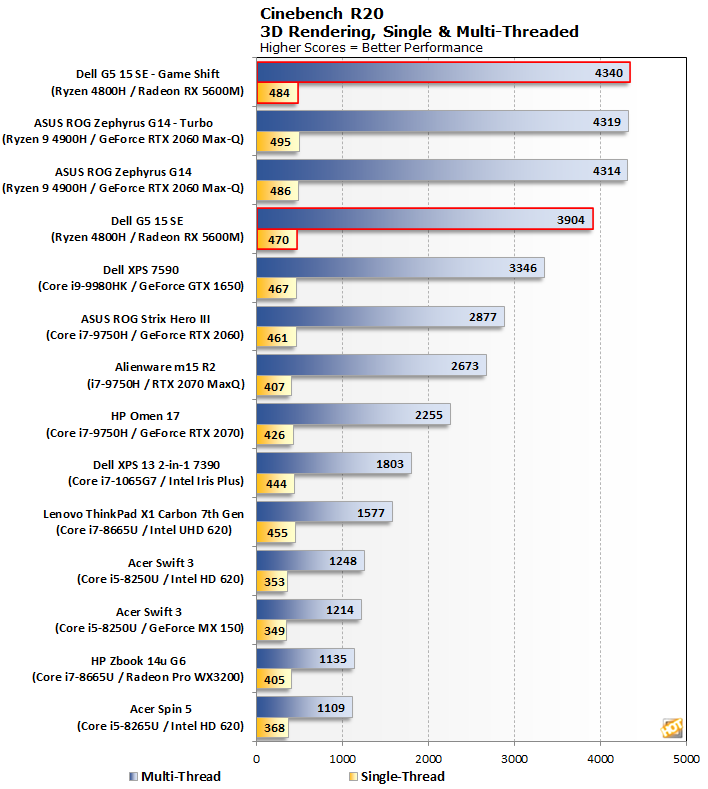
Here, Game Shift again has a measurable impact. The Dell G5 15 SE leapfrogs the ASUS ROG Zephyrus G14's Turbo mode to take its spot as the fastest gaming notebook we've tested in this multi-threaded benchmark. The hopped-up power profile also propelled the G5 15 SE to have the second best single-threaded performance of the pack, behind only one other AMD processor.
Interestingly, Game Shift affects both multi-threaded and single-threaded performance. The difference between Cinebench and web benchmarks like Speedometer is the burst-heavy nature of most web tests. By contrast, Cinebench is a constant strain on any given number of threads, so the extra thermal headroom comes in handy.
|
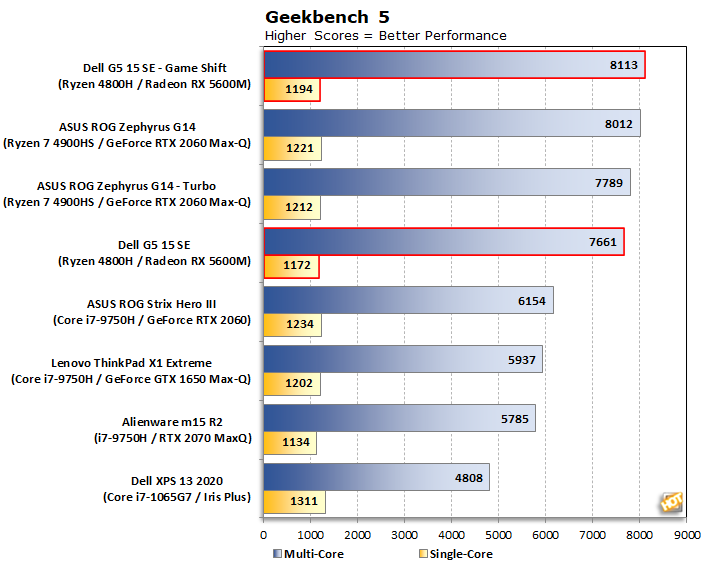
Geekbench was kind of an odd test for the Zephyrus, as Turbo mode was slower than regular, but that's not the case for the our Dell contestant. Once again, the magic number is seven, as in a 7% boost in performance in Game Boost mode. That was enough to catapult the G5 15 SE to the top of the multi-threaded charts once again. And just like before, the G15 only comes in second to the ASUS machine with a Ryzen 9 4900HS, which has a slightly higher maximum boost clock.
Let's take a moment and remember pricing on the G15. What we're testing here is a budget-friendly $1200 gaming laptop. We haven't gotten to the gaming benchmarks yet, but for general purpose tasks, this thing is shaping up to be a monster.
|
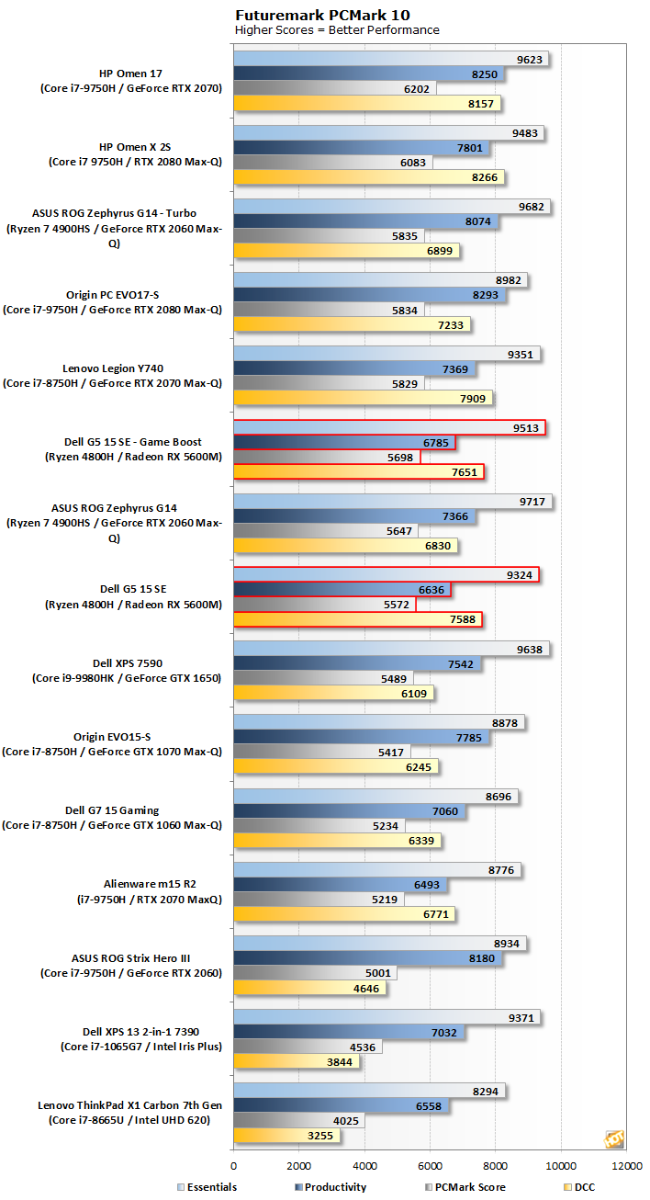
As it turns out, the G5 15 SE isn't the very fastest PCMark gaming notebook around, but it's still awfully darn fast. Across the board, the Dell system turned in excellent results. Overall, performance was roughly on par with the ROG Zephyrus G14 once more. The G5 played leapfrog with the ASUS system, and in the end the G14's Ryzen 9 processor was just a hair faster than the G5's Ryzen 7 4800H.
In particular, the high score in the Essentials test, which covers every day tasks like web browsing, video conferencing, and app startup time, means that the system is overall responsive. App loading in particular is something that just about everyone deals with daily, and the G5 15 SE scored well in this test.
If there's a small dim spot in this system's performance, it's the Productivity segment. This test focuses on office applications like spreadsheets and word processing. Having written this entire review on the G15, however, I can tell you that it's in no way slow at those tasks. Before getting too concerned, let's take a moment to refer back to the XPS 13 2020 review where a score around 6600 would have been towards the upper half of those tests. For a lightly-threaded test that relies on more than just the CPU (including the storage subsystem) there's nothing to be concerned about here.
Next up we'll take a look at 3D performance in 3DMark and several games, and also discuss battery life.


