The XPS 13 has a couple of performance rivals on our charts today. Obviously, the
XPS 13 7390 2-in-1 with the same Core i7-1065G7 and LPDDR4x memory should perform comparably. Our chart also has the previous iteration of the XPS 13 with the six-core Core i7-10710U, so it'll be interesting to see if the new version can keep up with multicore performance.
Last but not least, the
ASUS ROG Zephyrus G14 isn't a
direct competitor, but that laptop's crazy-high battery life and relatively small (but still bigger than the XPS 13) chassis make for an interesting mix of performance and portability. While we know the G14 has great performance, it is nearly 50% heavier than the XPS 13, so keep that in mind while we compare.
 |
| ATTO Disk Benchmark |
| Peak Sequential Storage Throughput |
|
The
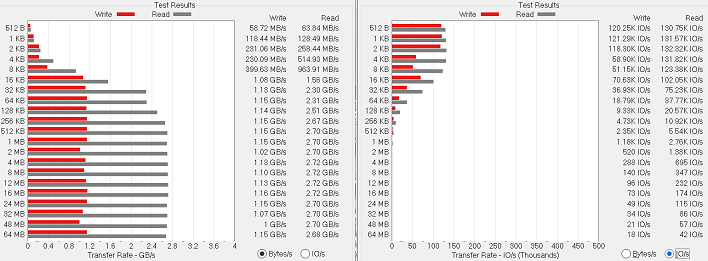
ATTO disk benchmark is a fairly quick and simple test which measures read/write bandwidth and IOPS across a range of different data sizes. While we don't typically compare these results across multiple machines, it's useful to gauge whether a particular notebook's storage subsystem can handle being put under pressure.
The XPS 13 has a 512 GB NVMe SSD in the M.2 2280 form factor, which is the most common drive size around these days. Based on its PCI ID displayed in Windows, this is part of
Intel's 660p lineup. Performance is pretty good, reaching up over 2.7 GB per second in reads, more than 1 GB in writes, and decent small-sized IOPS. While read speeds grow over time, IO rate drops off accordingly, since the larger chunks of data still represent one input or output. There's nothing alarming about the way the transfer rate rolls off.
 |
| Speedometer Web Application Benchmark |
| Browser Performance |
|
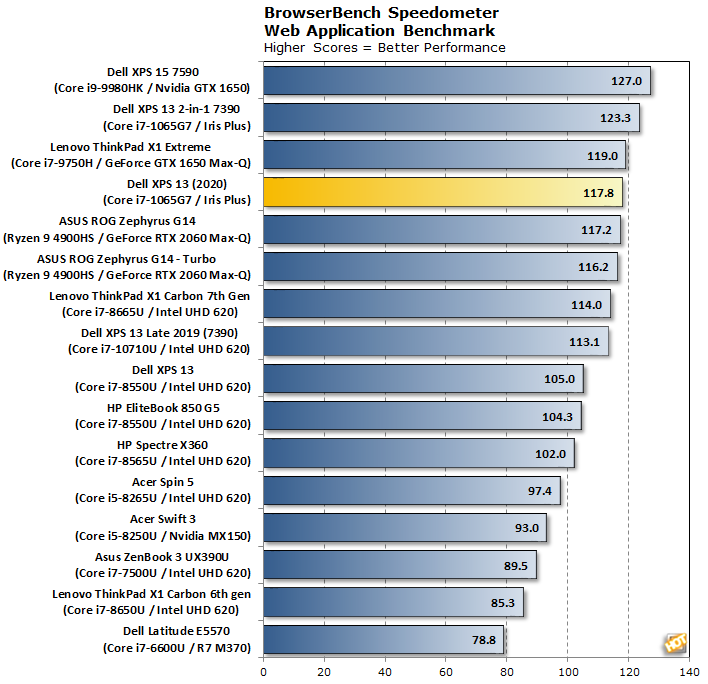
We recently moved on to BrowserBench.org's
Speedometer test, which takes a holistic look at web application performance. This test automatically loads and runs several sample webapps from ToDoMVC.com using the most popular web development frameworks around, including React, Angular, Ember.js, and even vanilla JavaScript. This test is a better example of how systems cope with real web applications, as opposed to a pure JavaScript compute test like JetStream. All tests were performed using the latest version of Chrome.
Our first CPU-bound performance test shows absolutely no surprises. The
Core i7-1065G7 has strong single-threaded performance, and the JavaScript on most websites is lightly threaded. As a result, the XPS 13 finds itself near the top of the charts. The only systems this one trails either have an identical processor (in the case of the XPS 13 2-in-1) or a processor with a much higher power budget. Let's move on.
|
|
Cinebench R15 and R20 |
| 3D Rendering Performance |
|
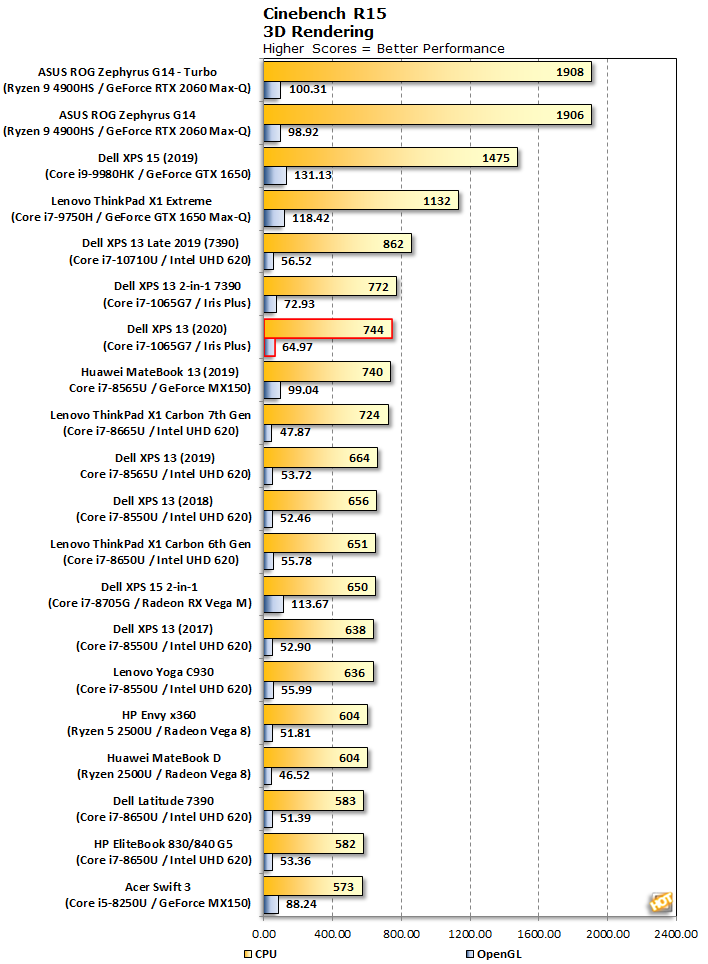
Cinebench R15 is a 3D rendering benchmark that tests both the CPU and GPU engines in the processor. Cinebench is developed by
Maxon, which is better known for its Cinema 4D software employed in professional 3D rendering and animation studios. We use both of Cinebench’s integrated tests for CPU and GPU.
The XPS 13 2-in-1 had already established that Ice Lake's multi-threaded performance was a step above all of the 8th-generation Kaby Lake Refresh processors. In this case, the XPS 13 also steps ahead of all those 8th-generation systems on our chart. The higher performance of its four cores still isn't quite enough to catch up to the hexacore
Core i7-10710U, but performance is awfully close.
On the OpenGL side, the XPS 13 performed pretty well, too. Its integrated Iris Plus graphics solution jumps ahead of the older UHD 620, although it trails its 2-in-1 sibling by a bit. None of that really matters when even a lowly GeForce MX 150 provides a 40% improvement over Intel's latest iGPU. Once we step up to a system with a decent discrete solution like the
GeForce GTX 1650, performance doubles up.
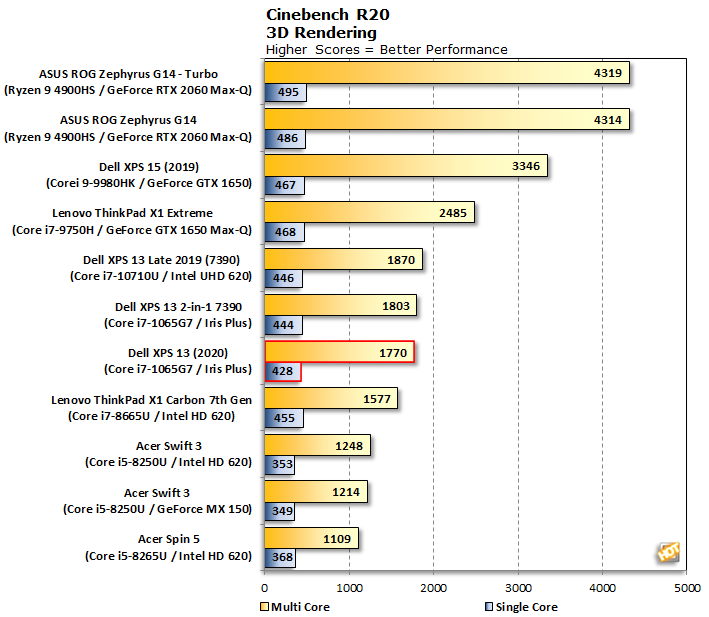
The latest version of Maxon's rendering benchmark,
Cinebench R20, takes longer to complete, so this is a better test of the XPS 13's cooling system. This release also drops the OpenGL test, making Cinebench a pure CPU benchmark this time. We tested both single-threaded and multi-threaded performance here.
Because Cinebench R20's workload takes much longer to process, the previous-generation hexacore XPS 13 feels a bit of thermal crunch, and as a result the new model pulls up basically dead even in multi-core performance. Single-threaded performance is pretty much flat across the board for the 8th and 10th generation Core CPUs in this test. AMD's new
Ryzen hotness speeds past all of those, though, in a footprint that's only a bit bigger than the XPS 13, though it does weigh a decent amount more.
|
| Geekbench 5 |
|
Single and Multi-Core Performance |
|
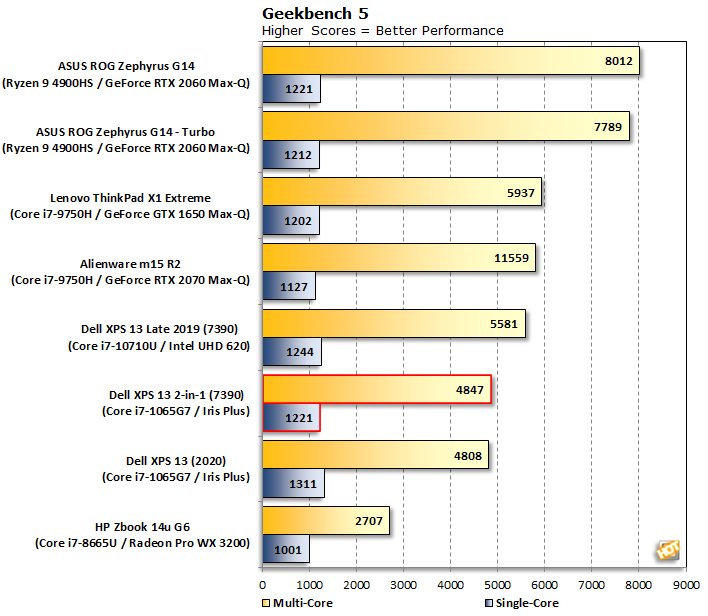
Geekbench is a cross-platform benchmark that simulates real world processing workloads in image processing and particle physics scenarios. We tested the notebooks featured here in Geekbench's single and multi-core workloads. We've retired Geekbench 4 because version 5 performs many of the same tests, which have been updated with the latest CPU architectures and features in mind.
Most of these systems have larger footprints and higher power requirements than the XPS 13, and Dell's mighty mini acquits itself nicely. Here,
Ice Lake's single-threaded performance really gets to stretch its legs. Unfortunately, multi-threaded performance lags behind the previous model's six-core processor. Once again AMD comes along and stomps on everything due to its additional core resources. We eagerly anticipate ultraportable, lightweight notebooks with lower thermal and power requirements. For now, however, the XPS 13 reigns supreme over any other ultraportable.
|
| PCMark 10 |
|
Productivity and System-level Benchmarking |
|
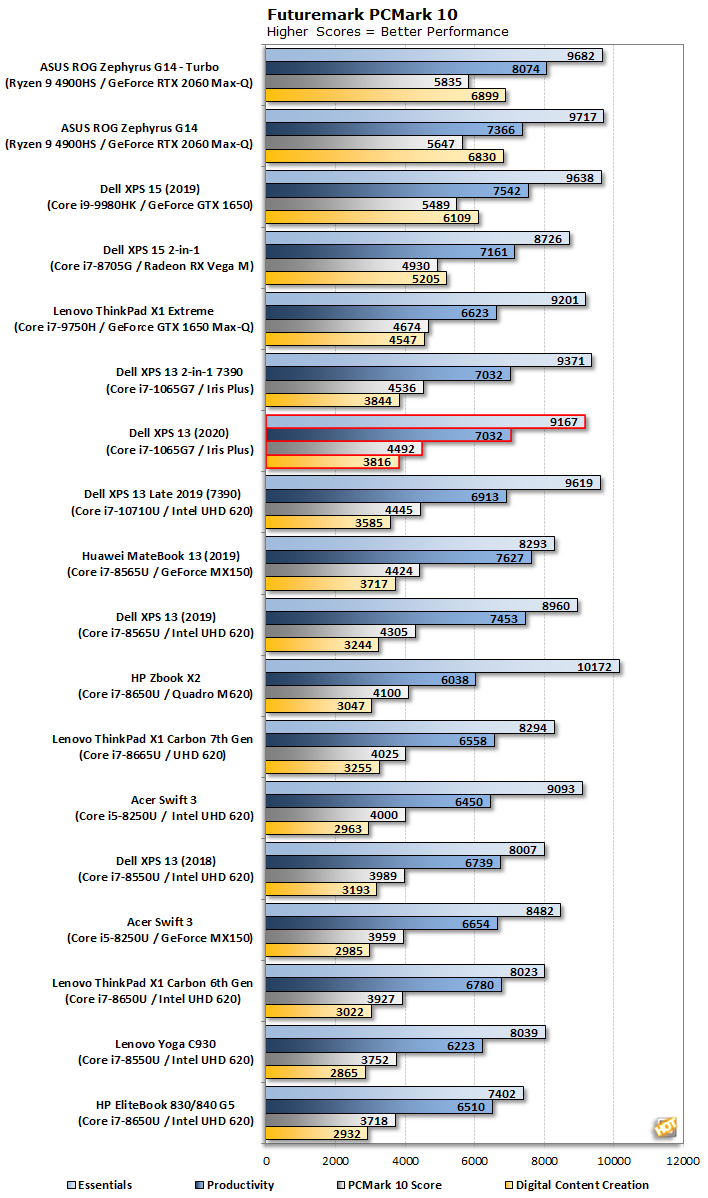
PCMark 10 uses a mix of real-world applications and simulated workloads to establish how well a given system performs productivity tasks, including image and video editing, web browsing, and OpenOffice document editing. While these scores appear to be all over the place, the systems are sorted by their overall PCMark score, which is the third (gray) bar in each cluster.
The
XPS 13 performs very well across the board in PC Mark 10, beating out all would-be ultraportable challengers. Because PC Mark's workload tends to favor lightly-threaded tasks (similar to a typical business laptop workload), the extra cores of the previous model go pretty much unused. While none of the XPS 13's sub-test scores stand out in any particular way, none of them are inordinately low.
|
| 3DMark Benchmarks |
| 3D Performance |
|
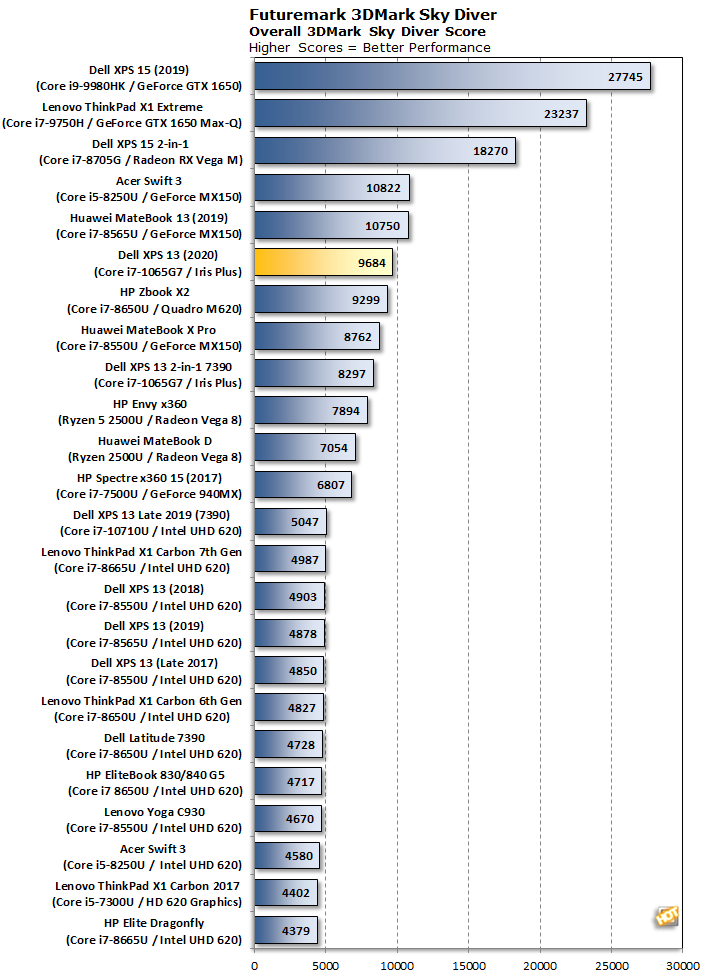
3DMark has several different graphics tests which focus on different types of systems. UL seems to have discontinued support for Cloud Gate, but fortunately there are a couple of tests remaining that run well on integrated graphics. First up is Sky Diver, which uses the DirectX 11 graphics API.
Iris Plus graphics lead the way here, in some cases more than doubling up the performance of the previous generation. The only way to get better 3D performance out of a laptop is to tack on some sort of discrete graphics solution, and even then, the low-end MX150 isn't really that much faster. It's only once we get to the GeForce GTX 1650 that it makes any sort of difference, and that GPU would add quite a bit of extra heat at the cost of battery life.
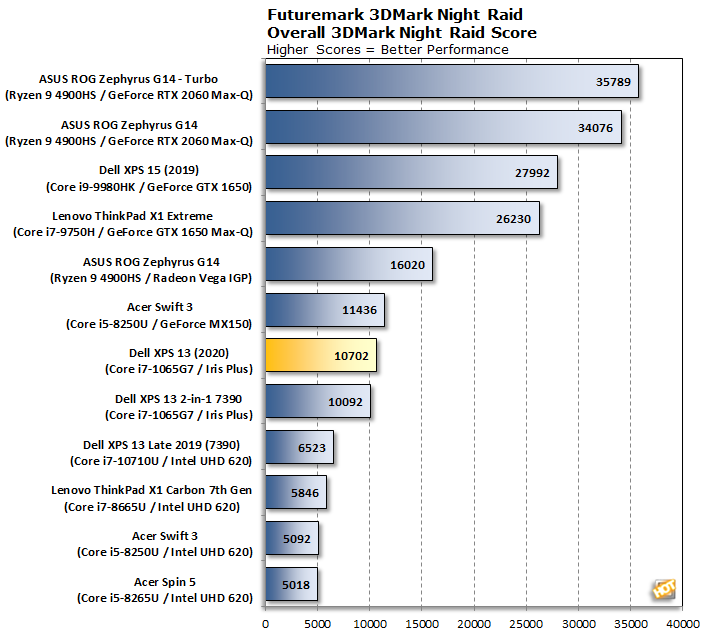
Next up is the DirectX 12 test for "basic" PCs, Night Raid.
This test is a fair bit newer than Sky Diver, so we don't have quite as many results. However, there's enough here to draw the conclusion that Iris Plus is still twice as fast as UHD 620, and still within spitting distance of the MX150. Again, all the
GeForce GTX 1650 variants take the lead in much bigger laptops. If you want the best 3D performance possible in this light of a package, the XPS 13 is as good as it gets. Whether it's good enough to sate your appetite depends on the games you play.
|
| GRID Autosport |
| Gaming Performance |
|
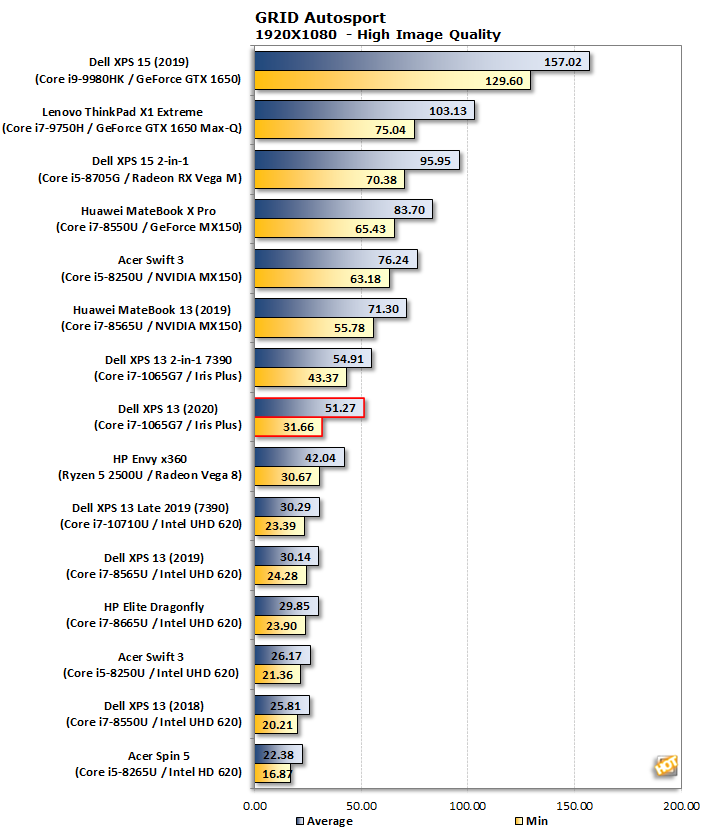
GRID Autosport is a cross-platform racing simulation developed by Codemasters. The developer wanted to make up for GRID 2, which released to mediocre reviews from critics and gamerse alike. Codemasters set out to improve
GRID Autosport's handling and environment rendering to make it a true racing simulator. The third GRID game is built on Codemasters' EGO engine that boasts more realistic physics and damage systems to add a bit of danger and some extra realism to the racing. Codemasters also tuned its graphics engine to perform well over a wide variety of mainstream systems, which makes it a great test for systems with integrated graphics. Codemasters also promotes that
GRID Autosport is "optimized for integrated Intel HD Graphics", which is certainly something. We tested at 1080p with the High image quality preset.
GRID Autosport is pretty darn playable at 1920x1080 and high settings, with a low frame rate still above 30 fps and an average frame rate up over 50. That low frame rate is still better than the average speed on previous generation Intel graphics, while still being quite a bit slower than a decent discrete solution. We don't think you'll be gaming much at 1080p and high settings on newer games like
Gears 5, but Iris Plus should still be enough to give road warriors a break from the real world from the comfort of their hotel rooms.
Next up we'll take a look at thermal and acoustic performance. There's a good amount of CPU and graphics horsepower here, but does the system get unbearably hot or whine like a jet engine?