Dell XPS 13 (2019) Review: A Refined 6-Core Ultrabook
Dell XPS 13 (2019) 7390: Storage, CPU And Productivity Benchmarks
Just like the 2-in-1 version of the XPS 13 was the first ultraportable we tested with 10-nanometer Intel CPUs, this traditional-looking model represents a first. This is the first time we've taken a 15W six-core processor for a spin. This will answer all the questions we asked earlier about whether this design choice on Intel's part favors multi-threaded loads or single-threaded tasks, or, hopefully, represents a nice bump in performance in both areas.
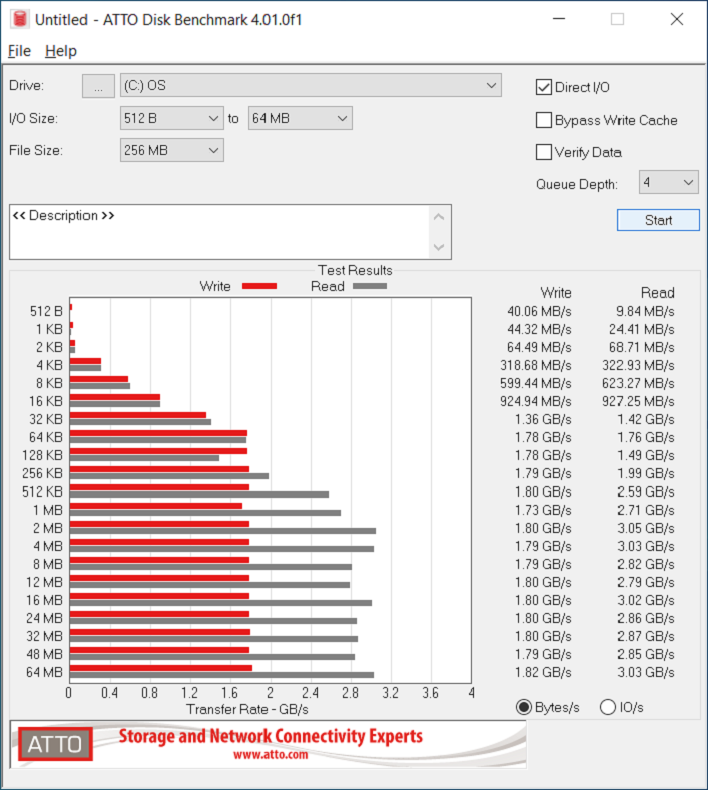
Dell has equipped the XPS 13 7390 with an PC601 NVMe SSD from SK Hynix in the typical M.2 2280 form factor. This drive has four lanes of PCI Express connectivity and is rated for 3.5 GB per second reads and 2.5 GB per second writes. We tested the drive using ATTO's Disk Benchmark, which is a relatively quick and dirty test that reports maximum read and write speeds for a variety of block sizes.

Much like other systems with 512 GB SSDs that have made their way through our offices, the primary storage in the XPS 13 7390 is pretty darn fast. In this case, ATTO reports that the drive gets up around 3 GB per second in sequential read operations once the block size hits 2 MB, and writes lag behind at 1.8 GB per second. These read and write figures are right in line with other systems we've tested with 512 GB solid state storage, so while the unusual SK Hynix drive doesn't make the XPS 13 stand out, it doesn't hold it back, either.
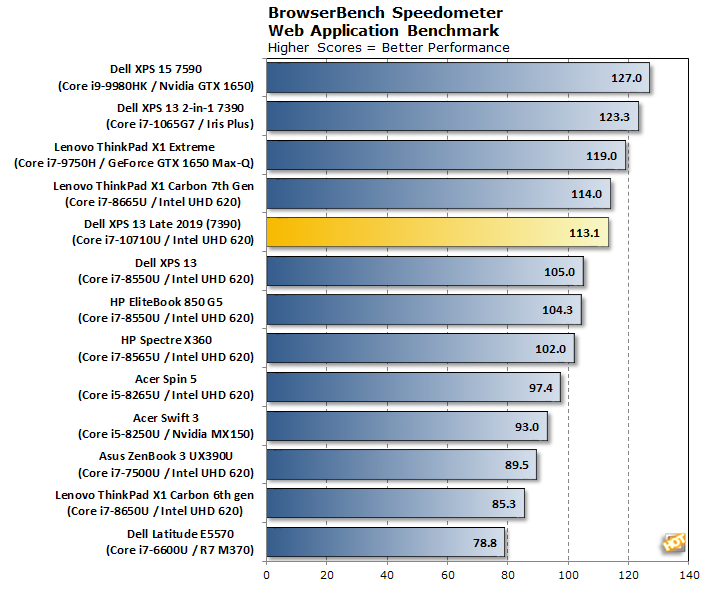
We recently moved on to BrowserBench.org's Speedometer test, which takes a holistic look at web application performance. This test automatically loads and runs several sample webapps from ToDoMVC.com using the most popular web development frameworks around, including React, Angular, Ember.js, and even vanilla JavaScript. This test is a better example of how systems cope with real web applications, as opposed to a pure JavaScript compute test like JetStream. All tests were performed using the latest version of Chrome.
Speedometer, like most JavaScript browser-based performance tests, is a lightly-threaded load that benefits from high IPC and high performance in lightly threaded loads. The XPS 13 7390 wasn't held back by the additional idle cores and basically ties the Lenovo ThinkPad X1 Carbon's Core i7-8665U. This is a good start, since the system apparently isn't trading single threaded performance for more cores.
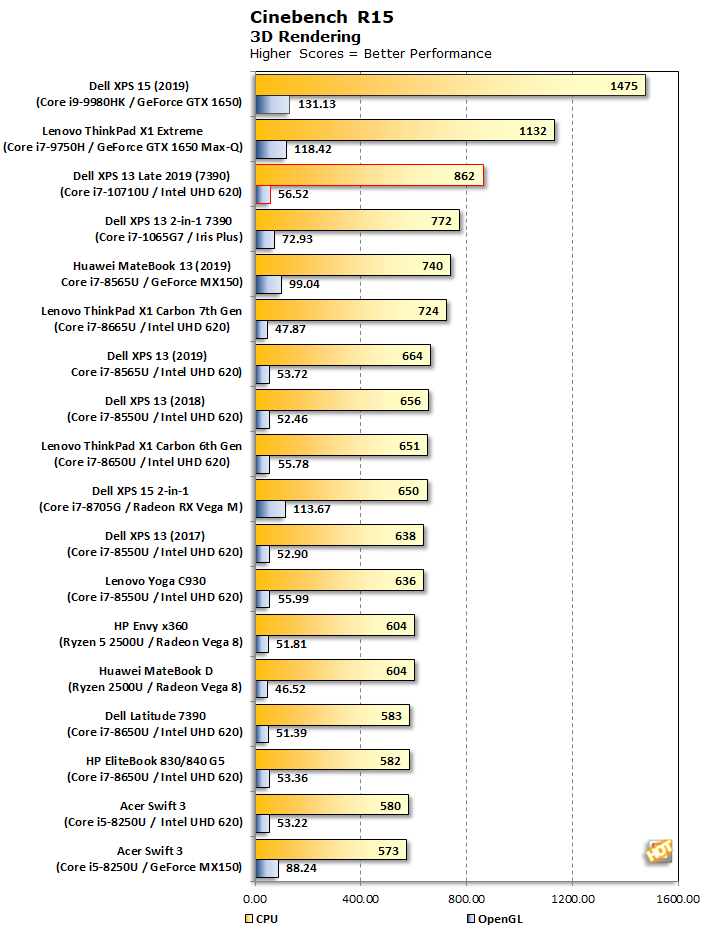
Cinebench R15 is a 3D rendering benchmark that tests both the CPU and GPU engines in the processor. Cinebench is developed by Maxon, which is better known for its Cinema 4D software employed in professional 3D rendering and animation studios. We use both of Cinebench’s integrated tests for CPU and GPU.
Unlike Speedometer, Cinebench R15's CPU test is heavily threaded. Because of that, the extra cores get to work and the CPU portion of our test sees the XPS 13 7390 eclipse all other low-power systems on our chart. The only other systems that pass it by have much higher TDPs and as a result much beefier cooling and higher operating frequencies. The XPS 13 lost to the Lenovo ThinkPad X1 Extreme and XPS 15, but that's it. Even the 10-nanometer wunderkind in the XPS 13 2-in-1 doesn't gain enough per-thread performance to catch up.
The OpenGL portion of the test is far less exciting, and the XPS 13 falls in line with the other systems with UHD 620 graphics. In fact, this Dell ultraportable posts the slimmest of victories over all the others, but it's not ground breaking. The Ice Lake CPU's enhanced graphics are around 50% faster than Comet Lake's.
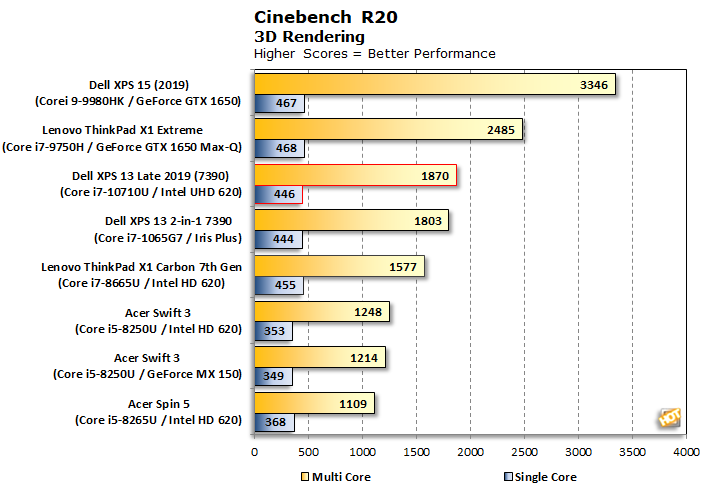
The latest version of Maxon's rendering benchmark, Cinebench R20, takes longer to complete, so this is a better test of the XPS 13 7390's cooling system. This release also drops the OpenGL test, making Cinebench a pure CPU benchmark this time. We tested both single-threaded and multi-threaded performance.
There's a very wide cross-section of CPUs in our results, and the XPS 13 clamshell falls into the upper half. Interestingly, thanks to its extra cores, Ice Lake's per-thread performance bump is offset entirely. Due to a much higher max turbo boost speed, the two XPS 13 systems essentially tie on single-threaded performance, too.
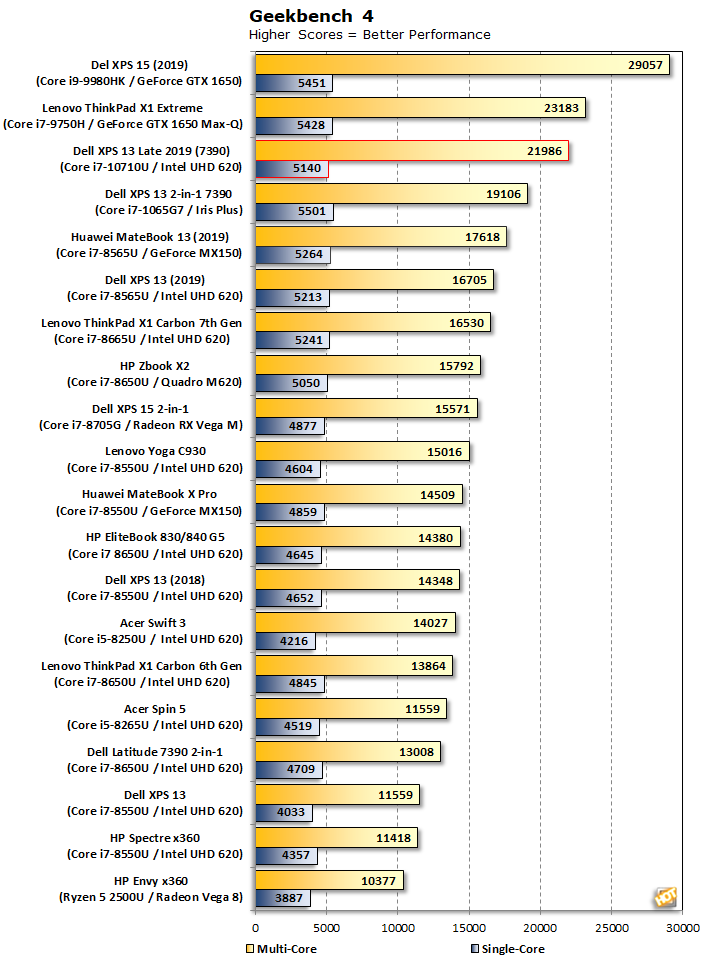
Geekbench 4 is a cross-platform benchmark that simulates real world processing workloads in image processing and particle physics scenarios. We tested the notebooks featured here in Geekbench's single and multi-core workloads.
From a single-core perspective, the Core i7-10710U in the XPS 13 7390 did alright on Geekbench, but it's the multi-threaded performance that shines. The XPS 13 7390 clamshell surpassed the fastest 8th-generation systems on our chart by more than 20% when all six cores were running. That's a far cry from the 50% advantage the system has in core count, but no doubt the system had to dial back core clock speeds a bit to keep all six cores under the thermal limit.
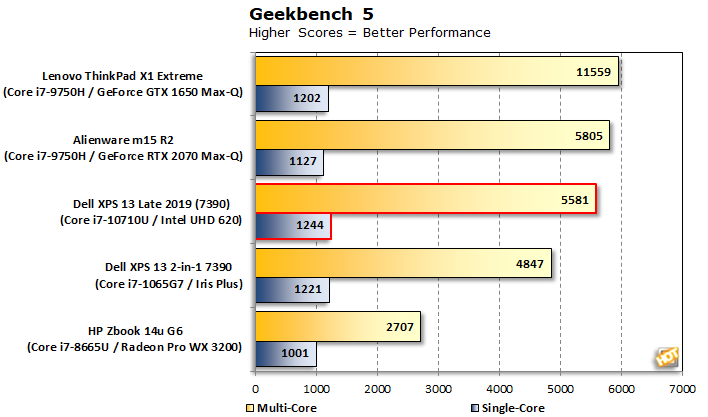
Geekbench 5 is the latest version of the Geekbench test suite which performs many of the same tests rewritten with the latest CPU architectures and features in mind. We've been slowly collecting these results over the last couple of months, and we finally have enough to share. Geekbench 5 results are not directly comparable with version 4 since the two apps use a different scale for their scores.
Again, the XPS 13 7390 clamshell excelled in Geekbench's multi-threaded tests, falling just a bit behind systems with higher TDPs. The single-threaded performance this time took home the prize, though, which is no meager feat considering the pair of Core i7-9750H systems in our field have a much higher thermal budget to play with.
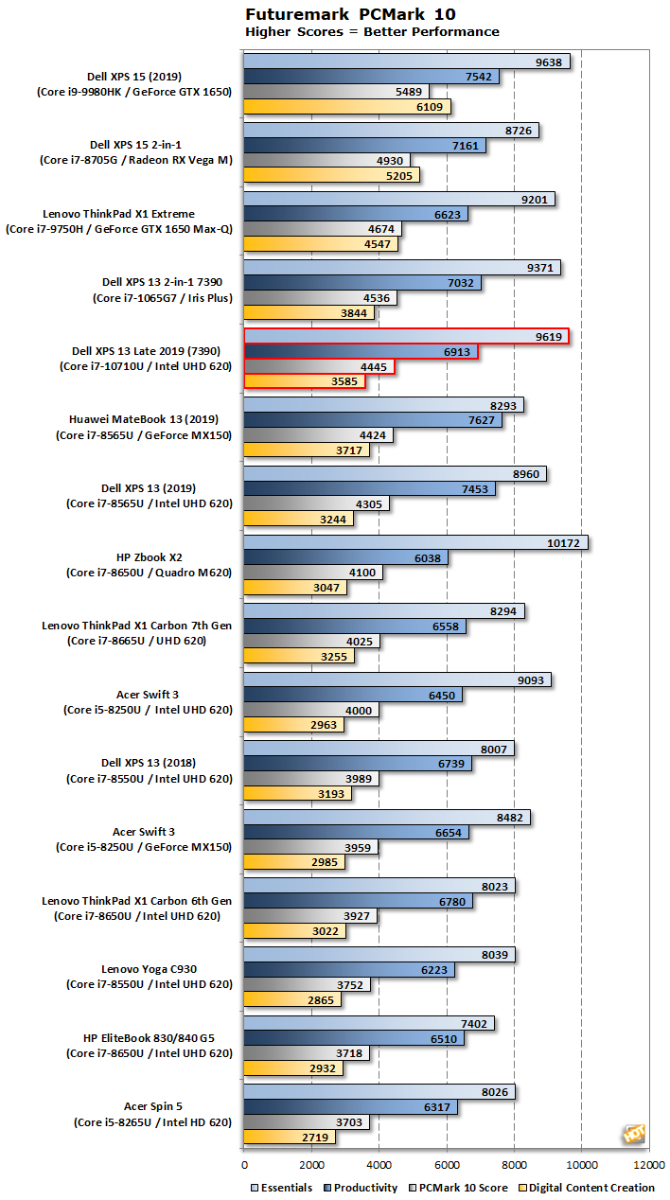
PCMark 10 uses a mix of real-world applications and simulated workloads to establish how well a given system performs productivity tasks, including image and video editing, web browsing, and OpenOffice document editing. While these scores appear to be all over the place, the systems are sorted by their overall PCMark score, which is the third (gray) bar in each cluster.
Dell's newest XPS 13 notebook takes home the crown in the Essentials test, and turns in a pretty respectable overall result, too. Considering that three of the four systems which placed above it have discrete graphics, which helps a lot in the Digital Content Creation portion of the suite, and high-power processors too, this 13" notebook does exceptionally well. The Dell XPS 13 7390 even beat out other systems with some low-end discrete graphics chips.
The only other system in its size class that scored as well overall is the Ice Lake-based 2-in-1, and that's in large part because of the graphics boost in DCC, not due to raw CPU performance (which is still pretty good, though). All of the 8th generation systems with integrated graphics fall behind here so it seems as though the extra CPU cores really help performance.
Speaking of graphics, while the XPS 13 7390 isn't a gaming machine, we'll take a look at what road warriors can expect from the comfort of their hotel rooms next...
|
Dell has equipped the XPS 13 7390 with an PC601 NVMe SSD from SK Hynix in the typical M.2 2280 form factor. This drive has four lanes of PCI Express connectivity and is rated for 3.5 GB per second reads and 2.5 GB per second writes. We tested the drive using ATTO's Disk Benchmark, which is a relatively quick and dirty test that reports maximum read and write speeds for a variety of block sizes.
Much like other systems with 512 GB SSDs that have made their way through our offices, the primary storage in the XPS 13 7390 is pretty darn fast. In this case, ATTO reports that the drive gets up around 3 GB per second in sequential read operations once the block size hits 2 MB, and writes lag behind at 1.8 GB per second. These read and write figures are right in line with other systems we've tested with 512 GB solid state storage, so while the unusual SK Hynix drive doesn't make the XPS 13 stand out, it doesn't hold it back, either.
|
We recently moved on to BrowserBench.org's Speedometer test, which takes a holistic look at web application performance. This test automatically loads and runs several sample webapps from ToDoMVC.com using the most popular web development frameworks around, including React, Angular, Ember.js, and even vanilla JavaScript. This test is a better example of how systems cope with real web applications, as opposed to a pure JavaScript compute test like JetStream. All tests were performed using the latest version of Chrome.
Speedometer, like most JavaScript browser-based performance tests, is a lightly-threaded load that benefits from high IPC and high performance in lightly threaded loads. The XPS 13 7390 wasn't held back by the additional idle cores and basically ties the Lenovo ThinkPad X1 Carbon's Core i7-8665U. This is a good start, since the system apparently isn't trading single threaded performance for more cores.
|
Unlike Speedometer, Cinebench R15's CPU test is heavily threaded. Because of that, the extra cores get to work and the CPU portion of our test sees the XPS 13 7390 eclipse all other low-power systems on our chart. The only other systems that pass it by have much higher TDPs and as a result much beefier cooling and higher operating frequencies. The XPS 13 lost to the Lenovo ThinkPad X1 Extreme and XPS 15, but that's it. Even the 10-nanometer wunderkind in the XPS 13 2-in-1 doesn't gain enough per-thread performance to catch up.
The OpenGL portion of the test is far less exciting, and the XPS 13 falls in line with the other systems with UHD 620 graphics. In fact, this Dell ultraportable posts the slimmest of victories over all the others, but it's not ground breaking. The Ice Lake CPU's enhanced graphics are around 50% faster than Comet Lake's.
The latest version of Maxon's rendering benchmark, Cinebench R20, takes longer to complete, so this is a better test of the XPS 13 7390's cooling system. This release also drops the OpenGL test, making Cinebench a pure CPU benchmark this time. We tested both single-threaded and multi-threaded performance.
There's a very wide cross-section of CPUs in our results, and the XPS 13 clamshell falls into the upper half. Interestingly, thanks to its extra cores, Ice Lake's per-thread performance bump is offset entirely. Due to a much higher max turbo boost speed, the two XPS 13 systems essentially tie on single-threaded performance, too.
|
From a single-core perspective, the Core i7-10710U in the XPS 13 7390 did alright on Geekbench, but it's the multi-threaded performance that shines. The XPS 13 7390 clamshell surpassed the fastest 8th-generation systems on our chart by more than 20% when all six cores were running. That's a far cry from the 50% advantage the system has in core count, but no doubt the system had to dial back core clock speeds a bit to keep all six cores under the thermal limit.
Geekbench 5 is the latest version of the Geekbench test suite which performs many of the same tests rewritten with the latest CPU architectures and features in mind. We've been slowly collecting these results over the last couple of months, and we finally have enough to share. Geekbench 5 results are not directly comparable with version 4 since the two apps use a different scale for their scores.
Again, the XPS 13 7390 clamshell excelled in Geekbench's multi-threaded tests, falling just a bit behind systems with higher TDPs. The single-threaded performance this time took home the prize, though, which is no meager feat considering the pair of Core i7-9750H systems in our field have a much higher thermal budget to play with.
|
Dell's newest XPS 13 notebook takes home the crown in the Essentials test, and turns in a pretty respectable overall result, too. Considering that three of the four systems which placed above it have discrete graphics, which helps a lot in the Digital Content Creation portion of the suite, and high-power processors too, this 13" notebook does exceptionally well. The Dell XPS 13 7390 even beat out other systems with some low-end discrete graphics chips.
The only other system in its size class that scored as well overall is the Ice Lake-based 2-in-1, and that's in large part because of the graphics boost in DCC, not due to raw CPU performance (which is still pretty good, though). All of the 8th generation systems with integrated graphics fall behind here so it seems as though the extra CPU cores really help performance.
Speaking of graphics, while the XPS 13 7390 isn't a gaming machine, we'll take a look at what road warriors can expect from the comfort of their hotel rooms next...


