Dell XPS 15 9510 Review: A Powerful RTX Laptop With OLED Pop
Dell XPS 15 OLED (9510): Benchmarks, Performance And Battery Life
Before running our selection of benchmarks, we apply the latest Windows and driver updates to the system we are testing (in this case, the XPS 15 OLED). Other than that, we run all our tests with out-of-the-box settings. Our goal is to test the system as it ships, but after auto-updating, to accurately reflect what buyers can expect from a retail experience.

The XPS 15 followed up its respectable storage sprint with an even more impressive Speedometer 2 benchmark mark, where it raced to the front of the pack with a score of 213.8. That's even slightly better than what we got from Dell's XPS 17 with a GeForce RTX 3060 inside, though for all intents and purposes, performance here is roughly the same (which is very good).
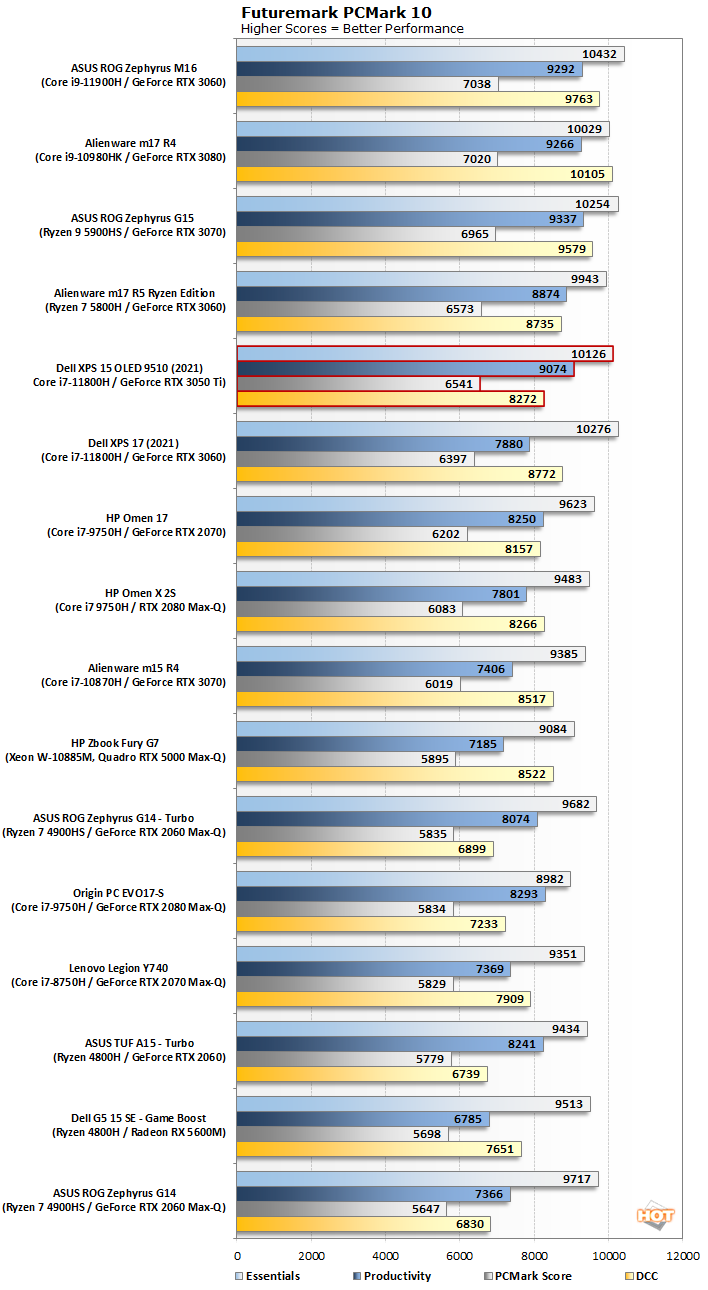
The XPS 15 bested its bigger sibling in PCMark 10, as it applies to the overall score, and finished in fifth place. It posted strong scores across the board, highlighting the capabilities of a well-rounded system from top to bottom.
We see the same thing in Far Cry 5, only this time time we don't have any integrated GPU performance numbers to compare against. What can be seen, however, are two ways to view this. If looking at the glass half empty, we're left thirsty for less of a performance gap between the XPS 15 and its GeForce RTX 3050 Ti, and the XPS 17 with its GeForce RTX 3060. The latter is more than 55 percent faster.
However, every notebook has different brightness ranges, so it’s critical to rely on a light meter, instead of a Windows brightness setting percentage, in order to level the playing field on brightness output. The Dell XPS 15 OLED required about 48 percent brightness to achieve 115 lux.
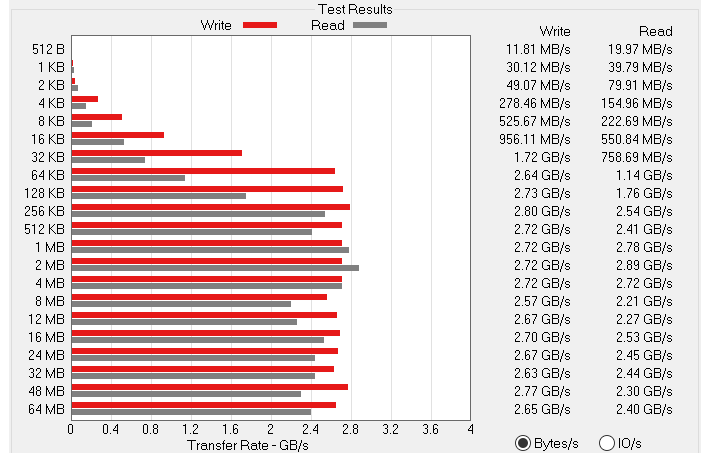
ATTO Disk Benchmark
The ATTO disk benchmark is a fairly quick and simple test which measures read/write bandwidth and IOPS across a range of different data sizes. While we don't typically compare these results across multiple machines, it's useful to gauge whether a particular notebook's storage subsystem can handle being put under pressure.Our XPS 15 system arrived with a 512GB Micron 2300 NVMe SSD, same as found in the larger XPS 17. On this model, Micron pairs its own 96-layer NAND flash memory chips with its own controller and firmware, and according to the rated specifications, it can achieve up to 3,300MB/s of sequential read performance and up to 2,700MB/s of sequential write performance.
The SSD didn't quite realize its full read performance potential in ATTO, though it came relatively close, peaking at 2.9GB/s. And in the write test, the drive exceeded its rating by a little bit, scaling to 2.8GB/s at its fastest point. These are not PCIe 4.0 levels of performance, but are still plenty speedy for the vast majority of tasks and workloads.
Speedometer Web Application Benchmark
BrowserBench.org's Speedometer test takes a holistic look at web application performance. This test automatically loads and runs several sample webapps from ToDoMVC.com using the most popular web development frameworks around, including React, Angular, Ember.js, and even vanilla JavaScript. This test is a better example of how systems cope with real web applications, as opposed to a pure JavaScript compute test like JetStream. All tests were performed using the latest version of Chrome.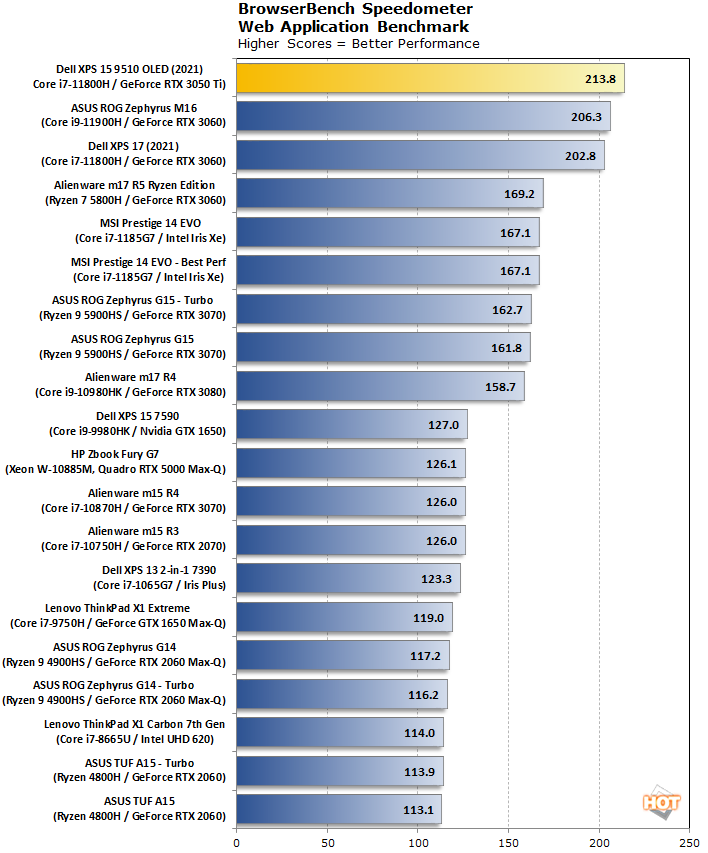
Cinebench R23
The Cinebench rendering performance test is based on Cinema 4D from Maxon. Cinema 4D is a 3D rendering and animation tool suite used by animation houses and producers like Sony Animation and many others. It's very demanding of system processor resources and can utilize any number of threads, which make is an excellent gauge of computational throughput. This is a multi-threaded, multi-processor aware benchmark that renders and animates 3D scenes and tracks the length of the entire process. The rate at which each test system was able to render the entire scene is represented in the graphs below.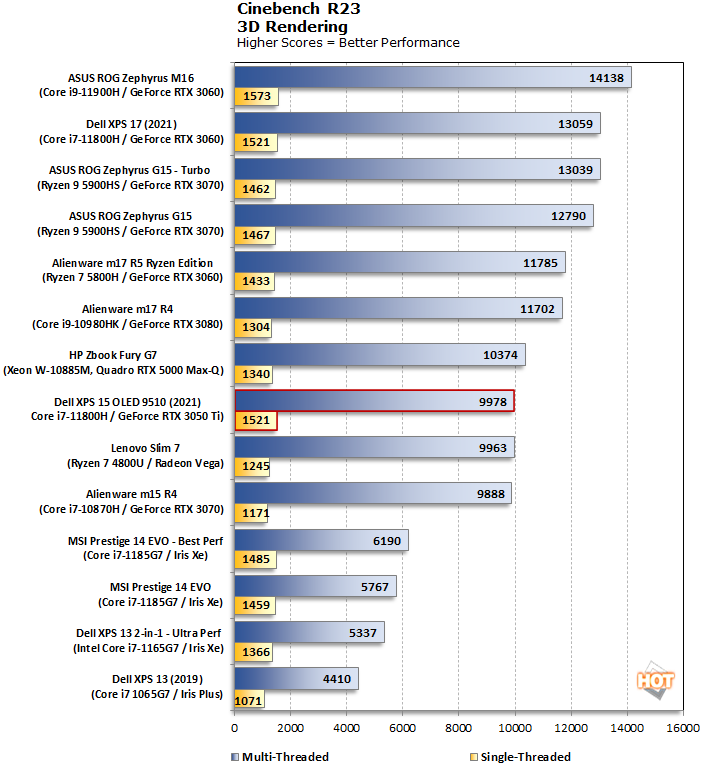
Turning our attention to Cinebench R23, the XPS 15 didn't battle for the top spot, and instead settled into the middle of the bunch in multi-threaded performance. Even though it's built around the same Core i7-11800H processor as found in the XPS 17, there's a scoring gap that is most likely a combination of variability when benchmarking, and there being more thermal and power headroom with the larger laptop's chassis and cooling system.
As it relates to single-threaded performance, the XPS 15 actually tied for second place among the systems highlighted here, scoring identically to the XPS 17 and come close to the ASUS ROG Zephyrus M16.
Geekbench Single And Multi-Core
Geekbench 5 is a cross-platform benchmark that simulates real world processing workloads in image processing and particle physics scenarios. We tested the notebooks featured here in Geekbench's single and multi-core workloads. We've retired Geekbench 4 because version 5 performs many of the same tests, which have been updated with the latest CPU architectures and features in mind.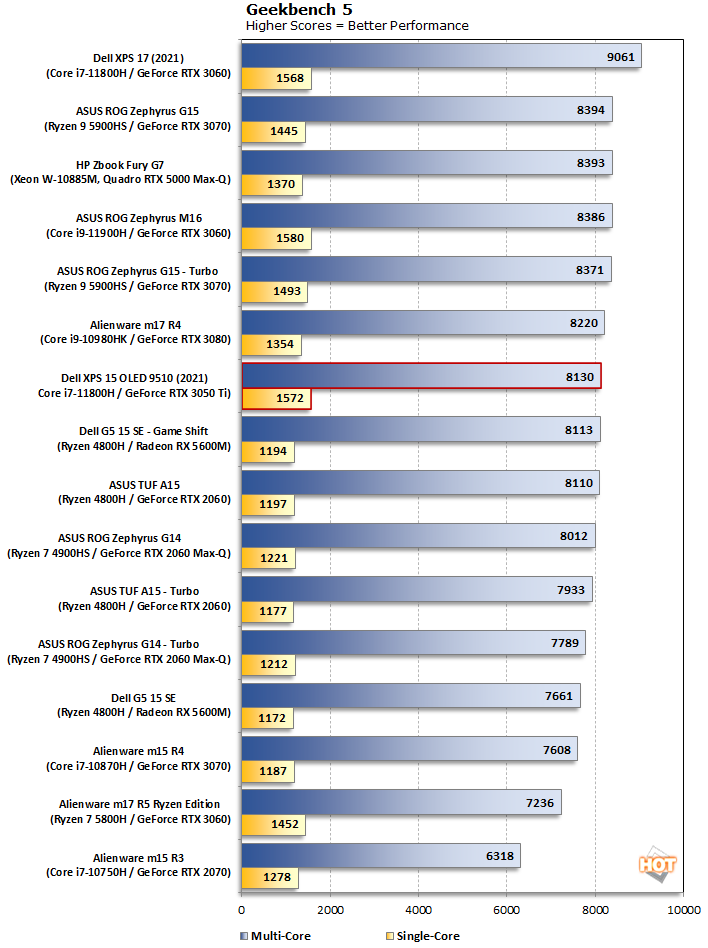
We saw more of the same in Geekbench 5. Once again, the XPS 15 came in a close second place to the ROG Zephyrus M16 when sorting by single-threaded performance, and mingled among the middle of the pack when sorting by multi-threaded scores. However, there's not a lot of separation in the latter between the XPS 15 and systems in front of it, save for the XPS 17, which again appears to have been able to create some separation from the cooling gains that a larger form factor inherently provides.
PCMark 10 Productivity And System Level Benchmarking
PCMark 10 uses a mix of real-world applications and simulated workloads to establish how well a given system performs productivity tasks, including image and video editing, web browsing, and OpenOffice document editing. While these scores appear to be all over the place, the systems are sorted by their overall PCMark score, which is the third (gray) bar in each cluster.
3DMark Benchmarks
3DMark has several different graphics tests which focus on different types of systems. Night Raid is recommended for systems with integrated graphics, including laptops, tablets, and other mobile computing devices.
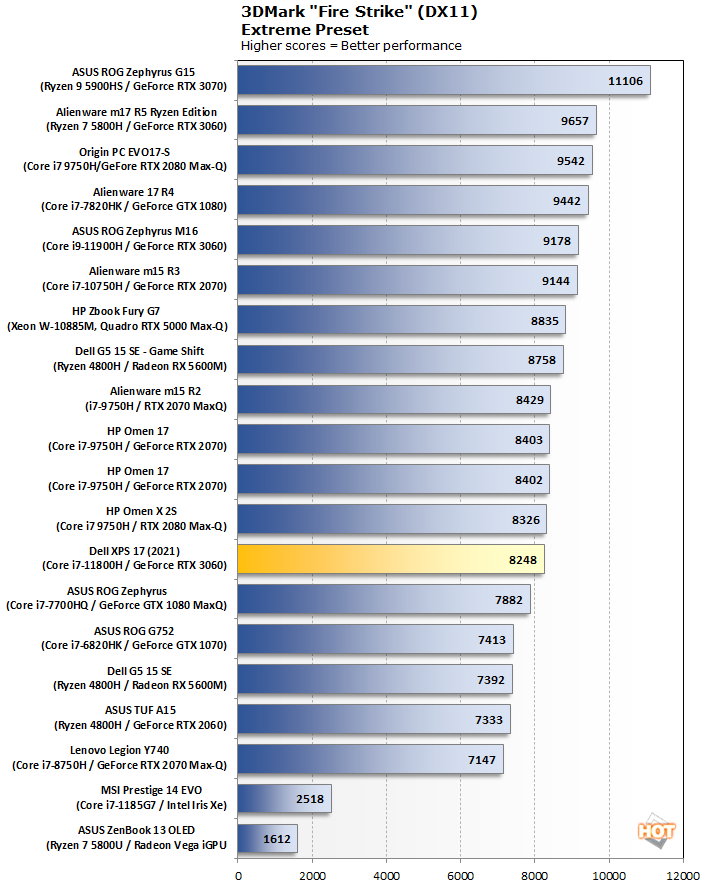
Even though Dell is offering a couple of discrete GPU options based on NVIDIA's latest generation Ampere architecture, the company is not pitching the XPS 15 as a gaming-first laptop by any means, and instead views those options as being intended for buyers who want gaming as a sidebar. This is evidenced in the 3DMark Fires Strike Extreme test—a score of 8,248 is respectable for what is primarily a productivity laptop, and certainly well above what most integrated graphics can muster.
That said, we did include a couple of laptops with integrated graphics into our chart above, to highlight the relative performance jump of even a lower end discrete GPU. And as you can see, it is a pretty big gap.
Middle Earth: Shadow Of War Gaming Performance
Middle Earth: Shadow of War is a fun and and beautiful title set in Tolkien's Lord of the Rings universe. To test the game's performance relative to other systems, we set the resolution to 1920x1080 and turned the visuals up to the High preset. The frame rates here are the average reported by the built-in benchmark.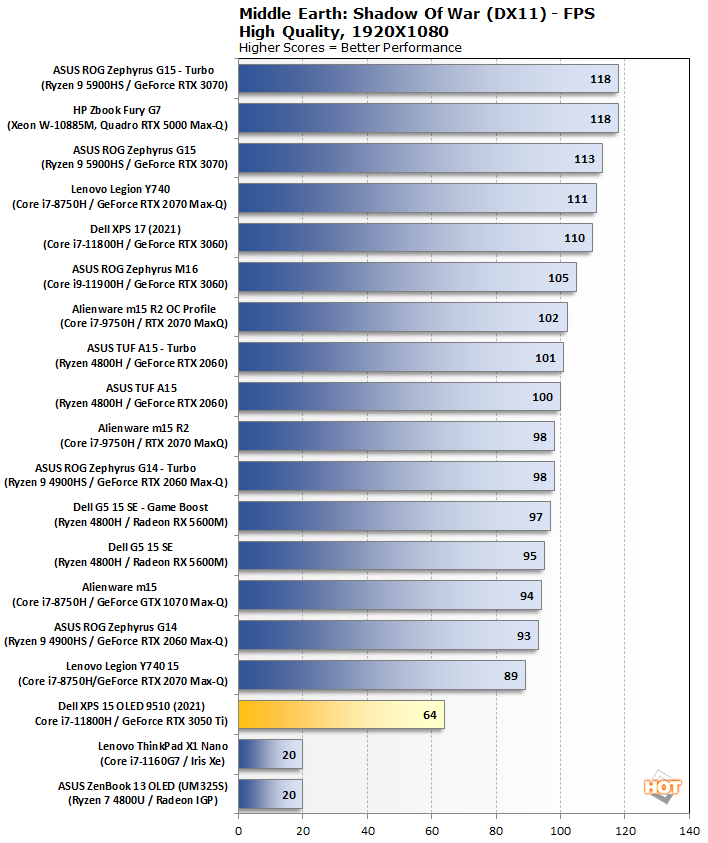
As we turn our attention to actual gameplay, we can see the limitations of the GeForce RTX 3050 Ti mobile GPU, relative to higher-end discrete GPU options and even the GeForce RTX 3060, which is only one tier above. That said, the laptop did manage a smooth 64 frames per second at the High quality preset. And once again, we've included a couple of laptops with integrated graphics for comparison. The XPS 15's gaming prowess may not be exhilarating, but it is more than three times faster here than the Lenovo ThinkPad X1 Nano (Iris Xe) and ASUS ZenBook 13 OLED (Radeon)..
Far Cry 5 Gaming Benchmarks
Far Cry 5 takes the franchise to Montana with lush environments and incredible graphics fidelity. We ran this laptop through the built-in benchmark with Ultra quality settings.
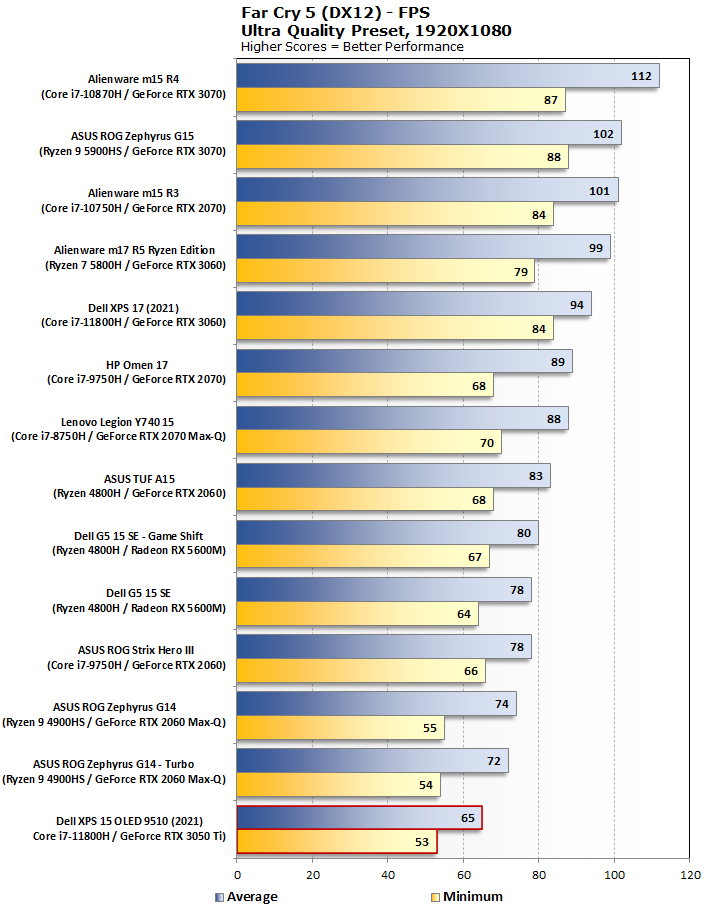
We see the same thing in Far Cry 5, only this time time we don't have any integrated GPU performance numbers to compare against. What can be seen, however, are two ways to view this. If looking at the glass half empty, we're left thirsty for less of a performance gap between the XPS 15 and its GeForce RTX 3050 Ti, and the XPS 17 with its GeForce RTX 3060. The latter is more than 55 percent faster.
Drinking from a glass that is half full, however, Far Cry 5 is another game where the XPS 15 can muster smooth frame rates with the visual settings cranked up (to Ultra). It averaged a very-playable 65 frames per second. Not too shabby in its own right.
Our Battery Life testing is performed using a custom 1080p HD video loop test we developed here at HotHardware. We conduct the tests with Windows 10 Quiet Hours / Focus Assist enabled and the display's brightness calibrated as close to 115 lux on our meters as possible. Brightness calibration is vital to ensure a fair comparison with other notebooks in our group, since it greatly affects battery life. Battery Life With XPS 15
However, every notebook has different brightness ranges, so it’s critical to rely on a light meter, instead of a Windows brightness setting percentage, in order to level the playing field on brightness output. The Dell XPS 15 OLED required about 48 percent brightness to achieve 115 lux.
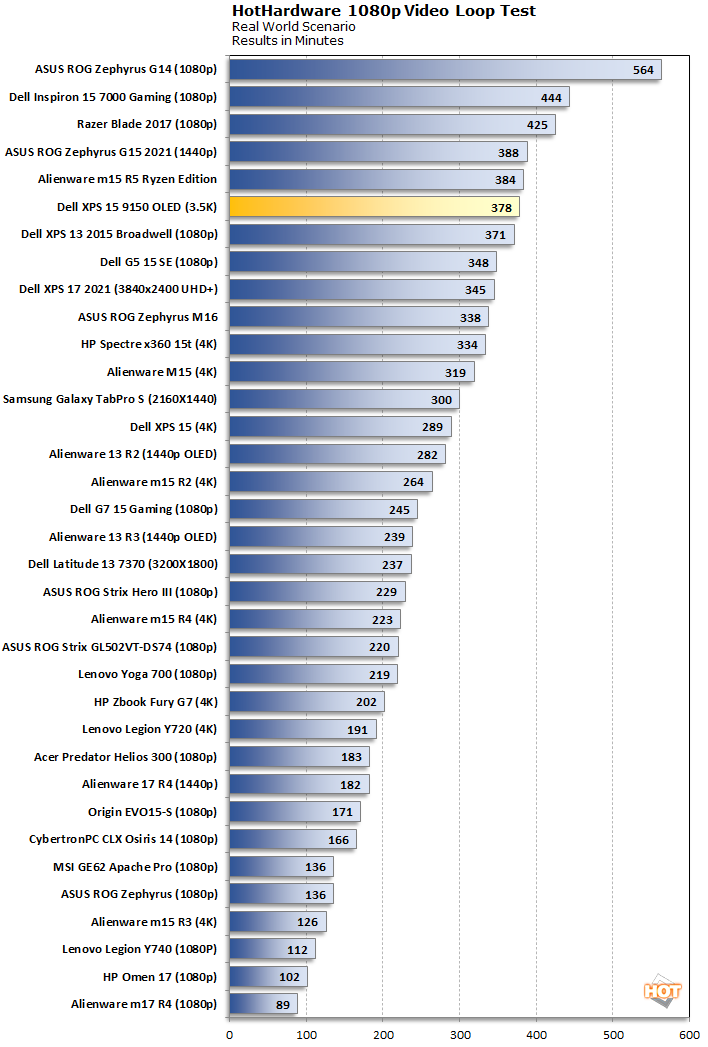
The XPS 15 OLED finished our roundup of benchmarks on a high mark, with battery life checking in at 6 hours and 18 minutes. That puts it near the top. Your actual run time will obviously vary depending on what you're doing—expect a full work day or more on lighter loads, or less if putting that GeForce RTX 3050 Ti to use in gaming. Bottom line, battery life is not a detriment on the XPS 15 OLED, but a strong point.


