To test the HP ZBook Firefly 14 G8, we ensured it was using the default power plan and installed all of the latest updates available via Windows Update. The Windows power slider was set to the default "Better Performance" setting, and we tested with the machine's default desktop resolution at 1920 x 1280, which is the native resolution for this display. We ran each test a minimum of three times and reported the median result.
 |
| ATTO Disk Benchmark |
| Peak Sequential Storage Throughput |
|
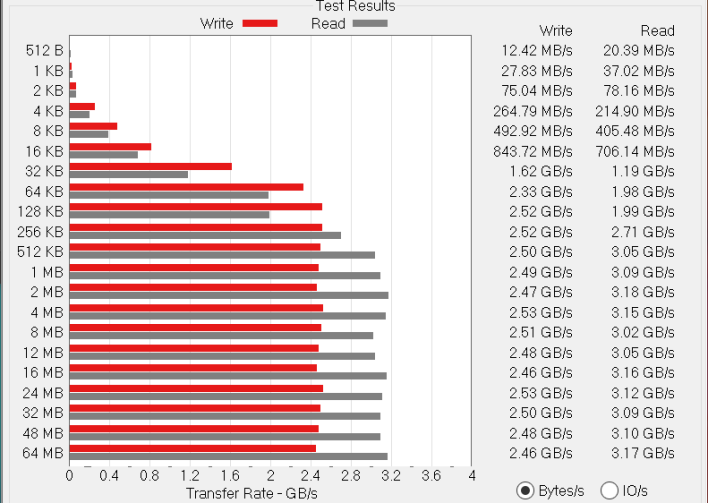
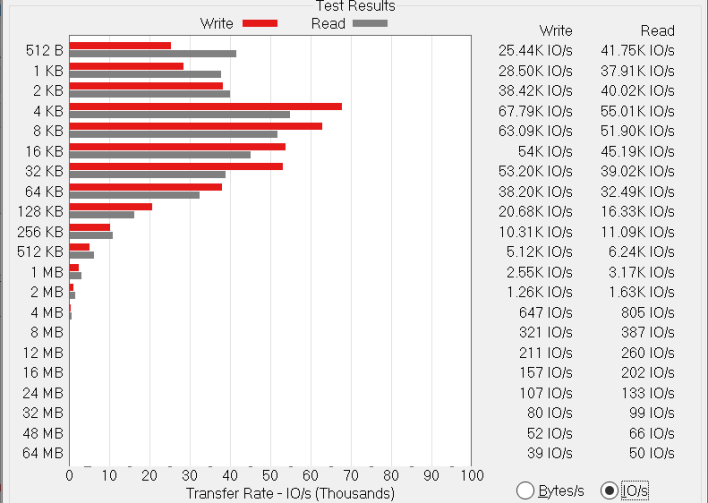
The
ATTO disk benchmark is a fairly quick and simple test which measures read/write bandwidth and IOPS across a range of different data sizes. We get a pair of results at each data point: bandwidth measured on MB per second (or GB per second if the result is that high), and input/output operations per second (IOPS).
The solid-state storage in the ZBook Firefly 14 G8 is a 512 GB
Western Digital SN730, which is a PCIe 3.0 NVMe SSD. The drive hits its rated 3.15 GB per second on reads and 2.1 GB per second for writes, and exhibits very solid IO performance as well. The system never feels sluggish or laggy, and apps open very quickly. That's what we'd expect out of a lightweight mobile workstation, so we're pleased with this result.
|
| Speedometer Web Application Benchmark |
| Browser Performance |
|
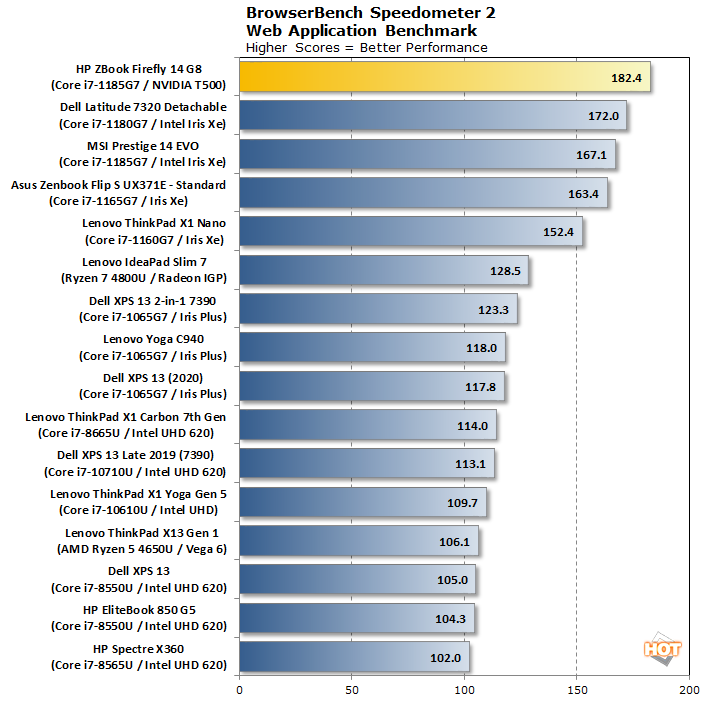
BrowserBench.org's
Speedometer is a real-world application of web application performance in the browser. This test automatically loads and runs several sample webapps from ToDoMVC.com using the most popular web development frameworks around, including React, Angular, Ember.js, and even vanilla JavaScript. This test is a better example of how systems cope with real web applications, as opposed to a pure JavaScript compute test like JetStream. All tests were performed using the latest version of Chrome.
Browser performance is mostly constrained by single-threaded throughput and latency, so the ZBook Firefly 14 shoots to the top thanks to its very fast Tiger Lake processor. Intel's latest CPUs have been dominating these charts for a while, so this is what we were hoping to see. Beating out the
MSI Prestige 14 EVO with its identical CPU by nearly 10% is a pretty good start.
|
|
Cinebench R20 & R23 |
| 3D Rendering Performance |
|
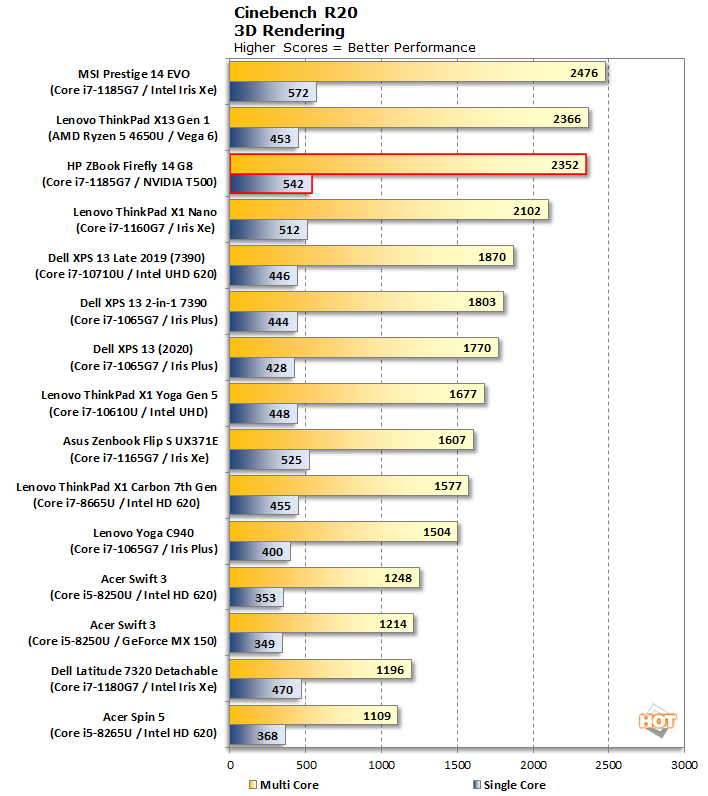
The previous version of Maxon's rendering benchmark,
Cinebench R20, uses a long, sustained load, which makes it a good indicator of how well the cooling system in a notebook performs. This version is a pure CPU benchmark, and we tested both single-threaded and multi-threaded performance here.
Cinebench R20 is much more multi-threaded, so the four cores finally get a good workout. Here we see the HP trail the MSI notebook, but it's only by around 3% in both single-threaded and multi-threaded performance. On the other hand, just about every other notebook looks pokey by comparison. The
Lenovo ThinkPad X13 Gen 1 has 50% more cores and threads, but only just ties HP's performance in the multi-threaded test.
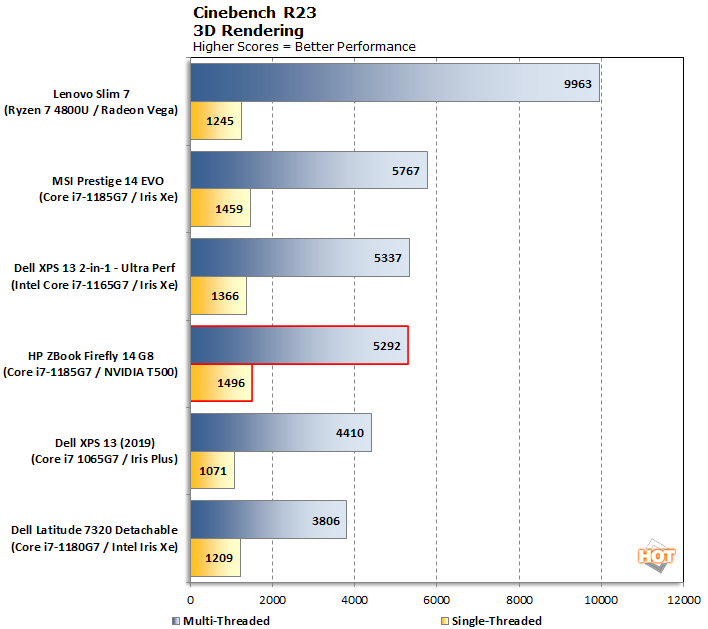
Recently, Cinebench R23 burst onto the rendering scene (heh), boasting new features like a sustained test and native support for Apple's M1 SoC found in the recent
2020 Mac mini, MacBook Air, and MacBook Pro. Windows devices also get the benefit of Maxon's latest rendering engine. The score scaling has changed, too, so these scores are not at all comparable to the last iteration.
Cinbench R23 shows much the same performance scaling as its predecessor in most cases, but the newer version seems to make much better use of AMD's many cores. The
Lenovo Slim 7 at the top of the chart has an eight-core processor, and it's nearly twice as fast as the HP here. When comparing to other Intel notebooks, it's a much closer race and again the ZBook scores similarly to the MSI Prestige 14 EVO.
|
| Geekbench 5 |
|
Single and Multi-Core Performance |
|
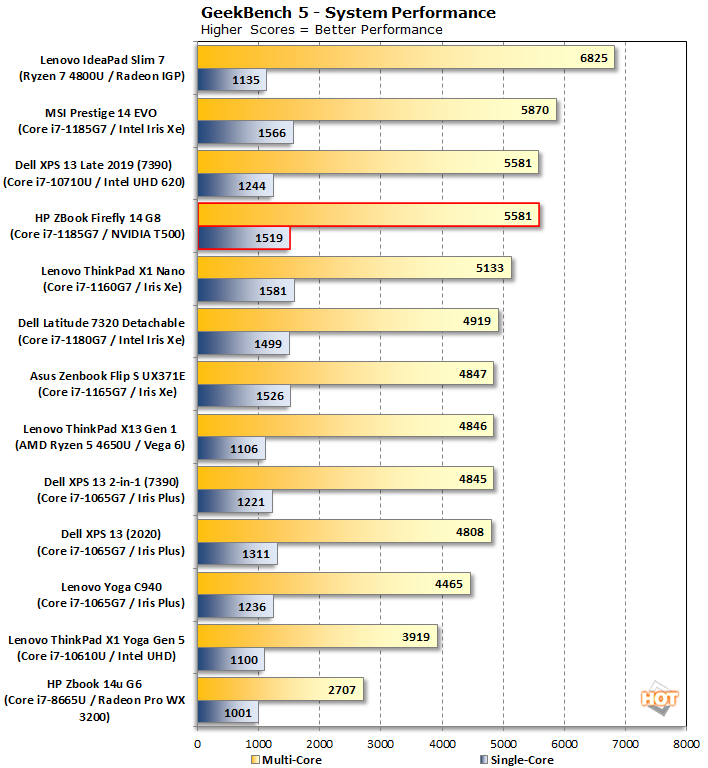
Geekbench is a cross-platform benchmark that simulates real world processing workloads in image processing and particle physics scenarios, among many others. We tested the notebooks featured here in Geekbench's single and multi-core workloads.
Geekbench, like Cinebench before it, can make use of as many threads as a CPU has, and the HP ZBook Firefly 14 sits right alongside its rivals from MSI and Dell. As has been the case all along, Tiger Lake CPUs absolutely dominate the single-threaded test, and again the HP impresses. Compared to the 10th-gen CPU in the
Dell XPS 13 7390, single-threaded performance is 25% higher, while tying on the multi-threaded test despite the Dell having half-again as many cores.
|
| PCMark 10 |
|
Productivity and System-level Benchmarking |
|
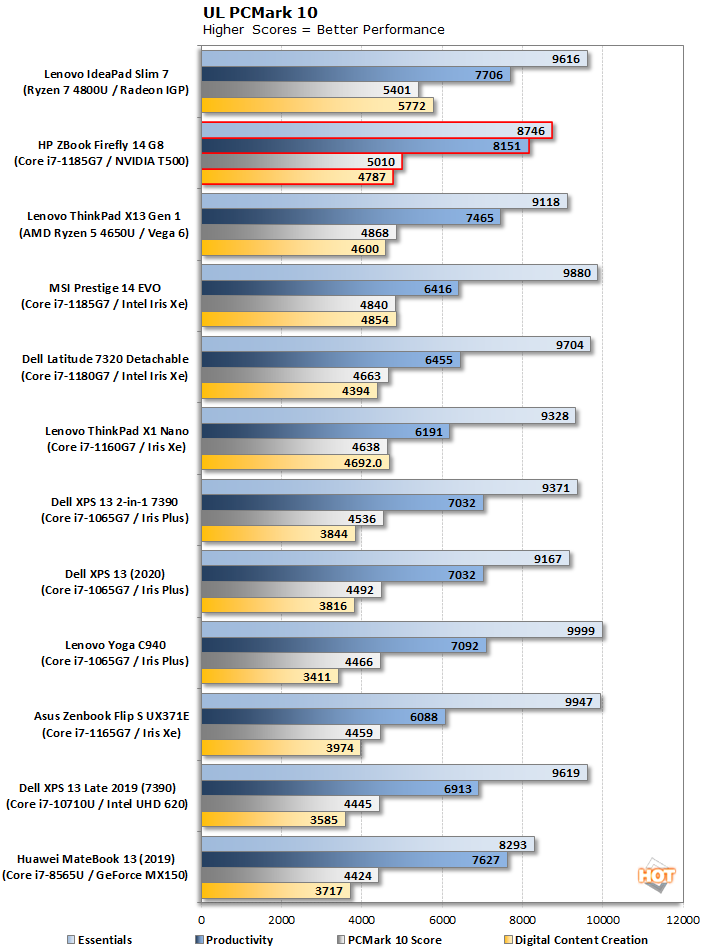
PCMark 10 uses a mix of real-world applications and simulated workloads to establish how well a given system performs productivity tasks, including image and video editing, web browsing, and OpenOffice document editing. While these scores appear to be all over the place, the systems are sorted by their overall PCMark score, which is the third (gray) bar in each cluster.
In PCMark, the HP is the fastest of all Intel-based ultra-portable notebooks. That's thanks in large part to a sky-high Productivity test score, where it bested the entire group by anywhere from 5% to 15%. It scored very well in the Digital Content Creation test as well, although the Essentials score is a bit off the other frontrunners. It wasn't enough to drag it back very far, though, as the ZBook Firefly 14 is second overall, and only trails the eight-core Lenovo IdeaPad Slim 7.
|
|
SPECviewperf 13 |
|
3D Modeling performance |
|
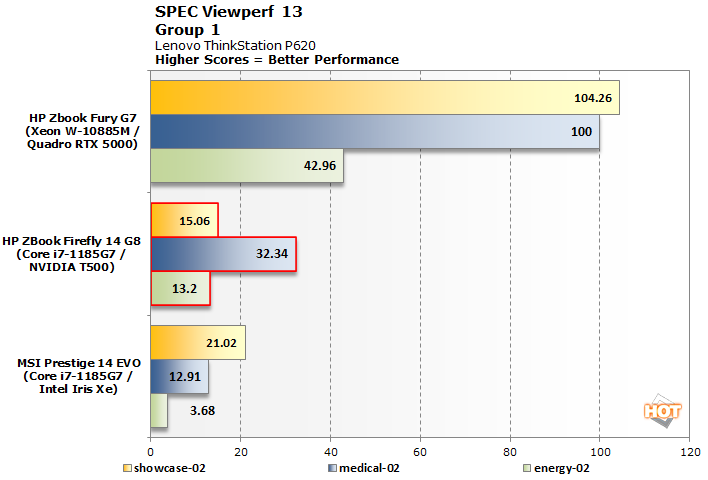
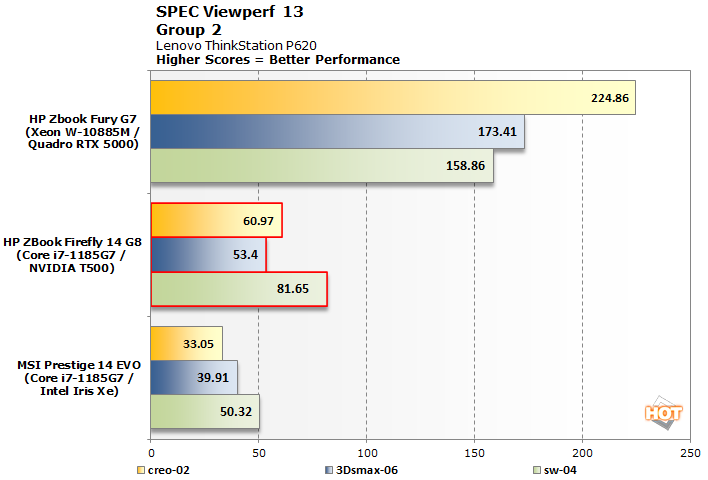
It's not very often that we get a mobile workstation with ISV-certified drivers through our offices, so there aren't a lot of points of comparison. However, we did this test on the hefty HP ZBook Fury 15 G7, and we also have an ultra-lightweight MSI Prestige 14 EVO in the house. This lets us see both ends of the spectrum: what upgrading from integrated Intel graphics nets us vs. what we give up by having a low-power discrete GPU aboard. SPECviewperf 13 lets us see how a multitude of 3D apps would perform on the ZBook.
This is what those ISV-certified drivers buy: greatly improved 3D performance. It's not really fair of us to compare the Firefly to the
ZBook Fury 15 G7, since that notebook weighs about twice as much and rings up for double what our Firefly does. Obviously, that notebook and its Quadro RTX 5000 GPU is going to clean up in this benchmark. That's exactly what happened, and we'll move on.
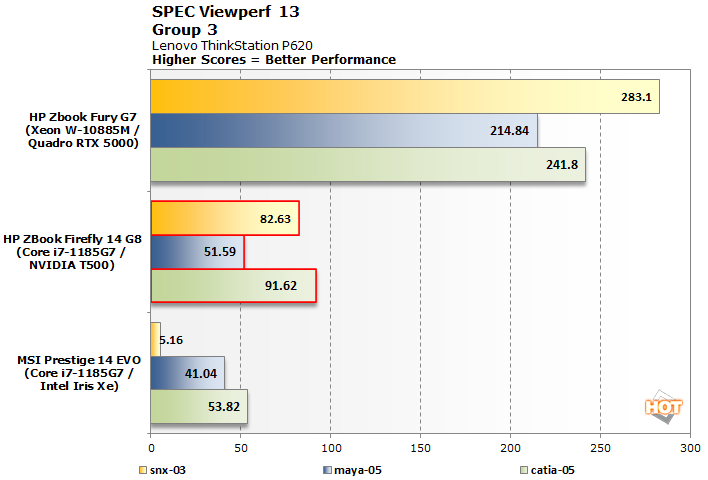
However, the real comparison we want to make is to the Iris Xe graphics in the Prestige 14 EVO, which
can complete all of these tests successfully, at least in terms of performance. As you can see, the ZBook's T500 handles these apps with much more fluidity. In one extreme case, the snx-03 subtest, the ZBook is 16 times faster going from an unusable 5 fps to up over 80. Intel did eke out a single win in showcase-02, but the margin of victor isn't nearly as extreme as some of what the ZBook could do. If having at least passable performance in these apps is important, the ZBook's discrete GPU is a necessity.
|
| 3DMark Benchmarks |
| 3D Performance |
|
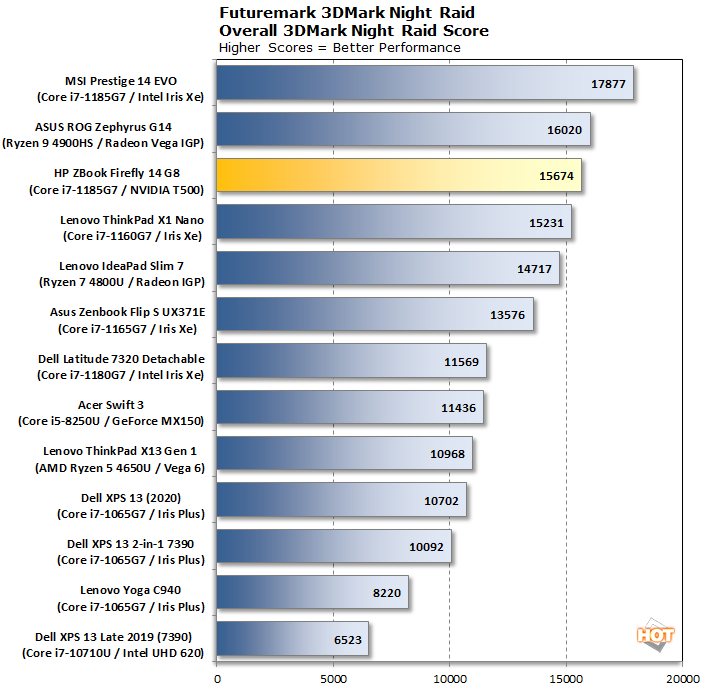
3DMark has several different graphics tests which focus on different types of systems. The most relevant of our tests is 3DMark's Night Raid, which uses DirectX 12 for its graphics tasks and has been tuned for integrated graphics. That means this is more CPU-focused than GPU focused, but still looks pretty nice despite that.
The NVIDIA T500 is definitely not a gaming GPU, but we're putting it through a gaming workload here. It's actually around 15% off the pace set by the MSI Prestige 14 EVO and its Iris Xe graphics, but the selling point for the HP is its certified graphics drivers, not synthetic 3D test performance. We're not overly concerned thanks to its performance in SPECviewperf 13, since that's the more important graphics-related result for a machine of this type.
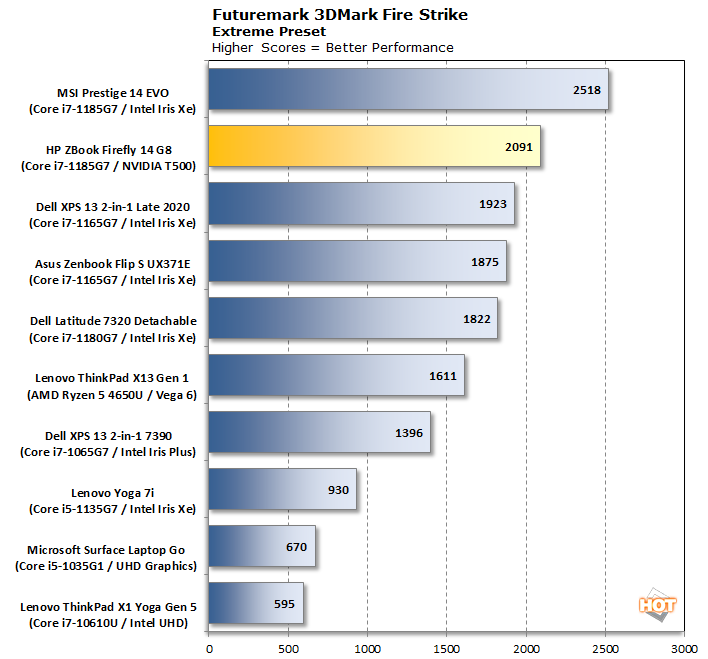
3DMark Fire Strike is a more intensive load that can still make gaming desktop systems work pretty hard. It's probably unfair to run it on integrated graphics, but we include it as a step-up from Night Raid.
Just like Night Raid, the T500 is again somewhat out of its element, but the performance is fine. Again, the Intel Iris graphics solution wins by a substantial margin, but we still think the T500 can keep a traveling gamer company in a hotel room.
|
| GRID Autosport |
| Gaming Performance |
|
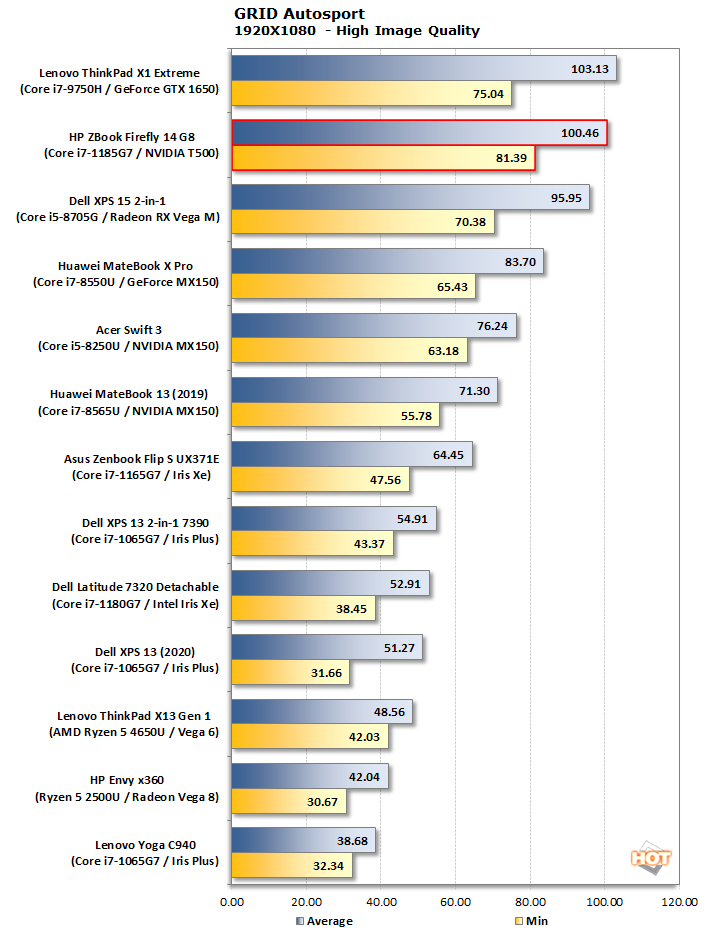
GRID Autosport is a cross-platform racing simulation developed by Codemasters. The developer wanted to make up for GRID 2, which released to mediocre reviews from critics and gamers alike. Codemasters set out to improve
GRID Autosport's handling and environment rendering to make it a true racing simulator. Codemasters also tuned its EGO 3 graphics engine to perform well over a wide variety of mainstream systems, which makes it a great test for systems with integrated graphics. We tested at 1080p with the High image quality preset.
As if only to prove our point, the T500's discrete GPU with its 4 GB of 64-bit GDDR5 places itself pretty high up the list of lightweight notebooks. Achieving an average of 100 fps in GRID Autosport should translate into playable framerates at lower quality levels on newer titles, and its full DX12 compatibility and NVIDIA's drivers mean that lightweight gaming loads should be just fine.
|
| Gears Tactics |
| UE4 Gaming Performance |
|
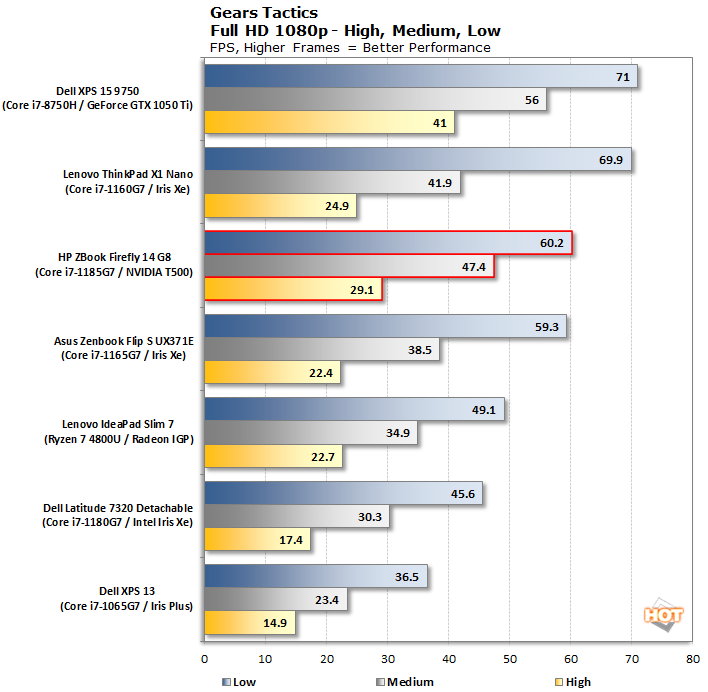
Gears Tactics is a much more recent title that runs on the Unreal 4 Engine. It's a pretty fun tactical real-time strategy game, and has a wide array of graphics options that can look pretty great if the system is up to the challenge. We turned off all the automatic frame rate adjustments, turned the resolution up to 1080p, and then tested at Low, Medium and High details settings.
Just as expected, the
ZBook Firefly 14 G8 can handle newer titles at lower settings. A solid 60 fps average on Low is obviously quite playable in this title, but even the medium setting's 47 fps is plenty smooth if a game doesn't rely on quick, twitchy movement. Gears Tactics does not, so that's quite a nice result. We think any traveler cooped up in a hotel with the ZBook will find plenty to do.
|
|
HotHardware Custom Video Loop |
|
Battery Life Performance |
|
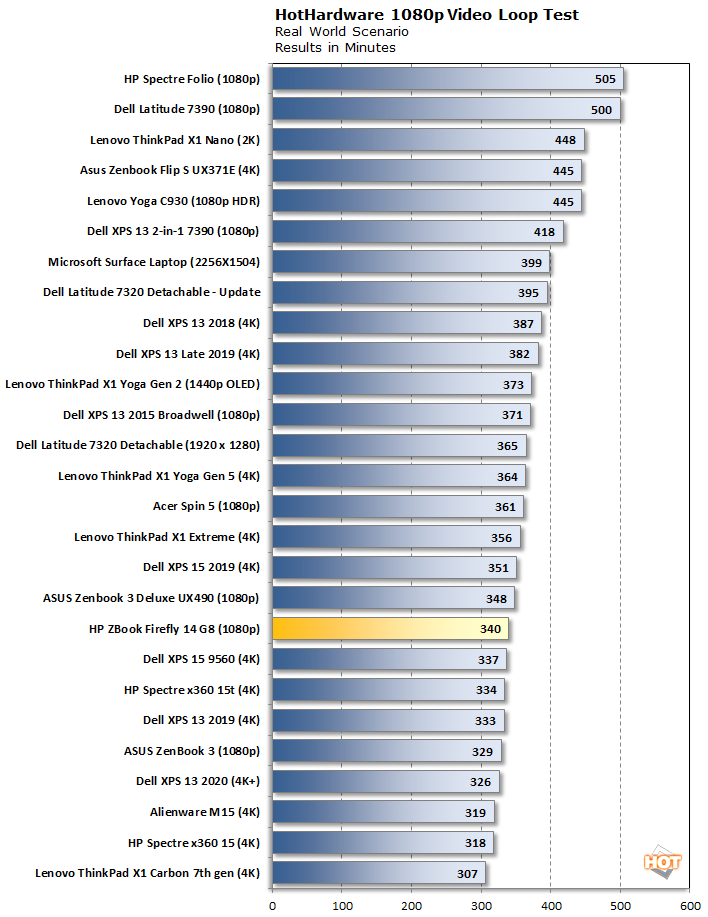
We run a custom 1080p HD video loop test developed in-house, to prove out battery life with our test group of machines. In all tests, Windows 10 Quiet Hours has been enabled and the displays are calibrated with lux meters on pure white screens to as close to 115 lux as possible. For the average laptop this is somewhere between a 40-60 percent brightness setting.
With a discrete GPU aboard, but a similar 50 Wh battery of its ultraportable rivals, perhaps it's not a surprise that the ZBook Firefly 14 G8 lags behind in battery performance. Still, more than five and a half hours is pretty solid on its own. It's only when we compare it to those other notebooks that it starts to look a little light in the battery department.
This is the tradeoff HP chose: a discrete GPU with with certified drivers in exchange for a little less battery performance. Considering the performance we observed in SPECviewperf 13, we feel that HP made the right call. The busiest of travelers might disagree, but HP's fast charging circuitry should make it easy to reclaim some battery life during a layover.
Next up it's time to dig into the system's internals and examine thermal performance before we wrap it up with our conclusions...