|


TESTING METHODOLOGY:
To
help fully explain the scores we listed in the
following benchmarks, we felt it was necessary to
explain how the systems were setup before running
the benchmarks. On all of the boards, we started off by
manually optimizing the
BIOS settings to the most aggressive system options
available. The memory
frequency was manually set to DDR333 with the
CAS timings set to 2-5-5-2 with a 1T command rate. The hard drive was
formatted, and Windows XP Professional with
Service Pack 1 was installed. After the Windows
installation was complete, we installed the
Intel Chipset update drivers and Application
Accelerator, and then installed the drivers for the rest of
the components, using the supplied on
the CDs.
For the GeForce card, we downloaded and installed the
latest NVIDIA reference drivers, version
41.03.
Auto-Updating, Hibernation, and System Restore were disabled,
and then we set up a 512MB permanent page file.
On these test systems we set the visual quality
to "best performance" in the system
properties as well as in the video drivers. With the newer 41.03 drivers,
there are options to set the level of the
drivers between "application" and "aggressive".
For this choice, we chose the aggressive
setting. Lastly, we installed all of the
benchmarking software, defragged the machine,
and rebooted one last time.
|
|
|
The Hot Hardware Test Systems |
|
Intel
Showcase... |
|
|
TEST BOARDS:
MSI 845PE Max2
Abit BE7 RAID
Gigabyte 8PE667
Ultra
COMMON
HARDWARE:
Intel Pentium 4 2.26 GHz 533MHz FSB
512MB Corsair PC3200 DDR
Chaintech GeForce 4 Ti 4600
On-board AC'97 audio
Western Digital WD200BB ATA100 7200rpm 20GB Hard
Drive
Creative Labs 52x CD-ROM
Windows XP Professional with Service Pack 1
Intel Chipset Drivers, version 4.00.1013
Intel Application Accelerator, version 2.2.2
NVIDIA Detonator Drivers, version 41.03
|
|
|
|
|
Performance Comparisons with SiSoft
SANDRA |
|
Synthetic
Action |
|
|
SANDRA (the System ANalyzer, Diagnostic
and Reporting Assistant) is an
information and diagnostic utility put out by the
folks at SiSoftware.
It's a quick and easy way to compare the CPU,
Memory, and Hard drive performance of a given system
against an internal database of similar systems
and drives. These benchmarks are theoretical
scores, and can't necessarily be quantified in
?real-world? terms, but provide a good way to make
comparisons amongst like components. For
each test that we ran, we chose components from
the database list that we thought would be found
in comparable mainstream PCs. We ran a set
of tests at 133MHz FSB, and then again at each
board's maximum stable overclock.
MSI
CPU Arithmetic
@ 133MHz
|
MSI
CPU Arithmetic
@ 166MHz
|
ABIT
CPU Arithmetic
@ 133MHz
|
ABIT
CPU Arithmetic
@ 166MHz
|
|
GIGABYTE
CPU Arithmetic
@ 133MHz
|
GIGABYTE
CPU Arithmetic
@ 168MHz
| As we
can see by the graphs above, all three boards are
good performers, and all fall within approximately
100 points of each other. The nod, although
slight, goes to the Gigabyte 8PE667 with a score
that actually falls above the stock score for a
Pentium 4 2.4GHz CPU. In fact, all of the
board scores come much closer to the P4 2.4 score
then we would have expected. The order of
the three boards remained the same after
overclocking them, with the Abit and MSI boards
reaching 166MHz for the front side bus, and the
Gigabyte 8PE667 topping the other two by hitting a
stable 168MHz.
MSI
CPU Multimedia
@ 133MHz
|
MSI
CPU Multimedia
@ 166MHz
|
ABIT
CPU Multimedia
@ 133MHz
|
ABIT
CPU Multimedia
@ 166MHz
|
|
GIGABYTE
CPU Multimedia
@ 133MHz
|
GIGABYTE
CPU Multimedia
@ 168MHz
| The
CPU Multimedia tests didn't offer any new
insights, with the order remaining with Gigabyte
in the lead, then the MSI 845PE, and finally the
Abit BE7. While the difference between the
two latter boards was a slight 27 points, the
Gigabyte board led the MSI board by close to 100
more points. The scores we achieved were
between the database scores for a P4 2GHz and a
2.4GHz CPU, as one should expect.
MSI
Memory @ 133MHz
|
MSI
Memory @ 166MHz
|
ABIT
Memory @ 133MHz
|
ABIT
Memory @ 166MHz
|
GIGABYTE
Memory @ 133MHz
|
GIGABYTE
Memory @ 168MHz
|
When
we got to the memory bandwidth test, we found that the
MSI and Abit boards exactly matched each other,
and the Gigabyte squeaked out a 10 point victory.
We were pleased with the results of these tests,
as they were better than the DDR333 scores found
in SANDRA's database for a competing chipset (the P4X333) and
right on target with the SiS645. The gap
between DDR and RAMBUS was narrowed to only 200
points in these tests, showing the major strides
that manufacturers have made with DDR memory. What really caught our attention
during these tests was the poor showing of the MSI
board
when overclocked. As mentioned earlier, the
BIOS settings on the MSI 845PE Max2 sets the speed
for the RAM, rather than letting it scale with the
speed of the front side bus. In doing so,
overclocking actually resulted in a decrease in
memory performance, dropping 40 points while the
other two boards saw increases of 600-650 points.
|
MSI
File System Performance
|
ABIT
File System Performance
|
GIGABYTE
File System Performance
| All boards
produced scores well above the database score for
a standard ATA100, 7200rpm hard drive using a FAT32
partition.
The Abit board held a slight lead over the
others, getting an extra 100 points in file
system performance courtesy of the superior
HPT/372 controller.
|
|
|
Performance Comparisons with PC Mark
2002 |
|
CPU and
Memory Testing |
|
For
our next comparison, we chose
MadOnion?s PCMark 2002. PCMark 2002 performs a
series of tasks such as image compression,
text searches, and audio conversion to give us
three scores: CPU, Memory, and Hard Disk Drive (HDD).
It is a relatively quick process for comparing the
performance of two or more systems. We ran a
set of tests at 133MHz and then ran another set after getting
a stable overclock, 166MHz FSBs for the Abit and MSI boards
and 168MHz for the Gigabyte.
We
expected that these scores would follow what we
originally saw with SANDRA 2002, and we were not
surprised. While we tried to keep BIOS
settings as similar as possible, the Gigabyte
board dominated these tests, beating out the Abit
board by 50 points, which had moved ahead of the
MSI board by 25 points itself. After
overclocking the boards, we found the difference
between the Abit and MSI boards to be relatively
unchanged. The Gigabyte 8PE667 improved its lead,
however, benefiting by the extra 2MHz we managed
to add to the FSB.
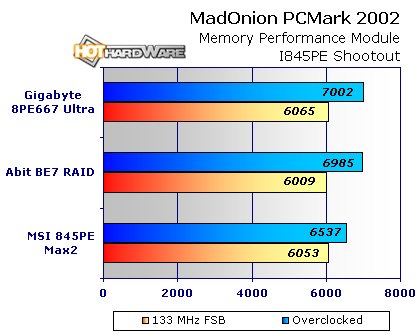
Here
we saw a flip-flop of the second and third place
boards. The MSI board had an impressive
showing, as did the Gigabyte 8PE667, with the Abit
board bringing up the rear. Although it had
a great first showing, the MSI 845PE Max2's Memory score suffered
after overclocking, just reaching over 6500.
The other two boards were up near the 7000 mark,
an 8% difference in performance over the MSI 845PE
Max2. Basically, the MSI board
got an 8% increase when overclocked, but the Abit
and Gigabyte boards saw a 17% increase, which more than
double the MSI board.
All of the hard drive scores were
neck and neck, finishing within 35 points of each
other. Since all boards were using ATA100 IDE
controllers, there really shouldn't be much of a
difference, especially considering they were all
using the same drive, reformatted for each setup.
If we had to pick a winner here, we would pick the
Abit BE7, since it came in first for both rounds
of testing.
|
|
Some Gaming
Scores...
| |