Intel Core i9-14900KS Review: The Fastest Desktop CPU Yet


Intel Core i9-14900KS Review: 3D Rendering, Audio and Video Encoding

core i9 14900ks bottom
In our custom LAME XP MP3 encoding test, we convert 16, large uncompressed WAV files to the MP3 format, which is a common use case for many end users, to provide portability and storage of their digital audio content. The LAME engine is an open-source MP3 audio encoder that is used widely in a multitude of third party applications.

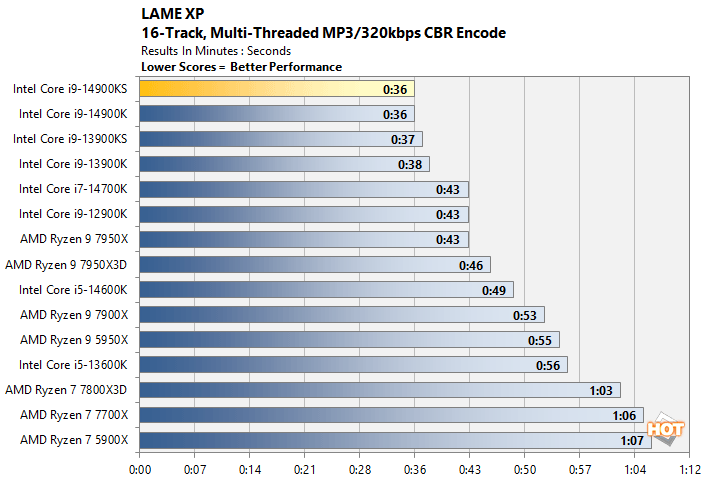
LAME XP Audio Encoding

For this test, we created 16-copies of our own 223MB WAV file (an 11 minute Grateful Dead jam) and converted it to the MP3 format using the multi-thread capable LAME XP tool. Processing times are recorded below, listed in minutes:seconds. Shorter times equate to better performance.
lame core i9 14900ks benchmarks

Intel's architectures perform particularly well with the LAME audio encoder. With that in mind, it's no surprise that the Core i9-14900KS outruns all of its competition yet again, save for the 14900K, which put up the exact same time.

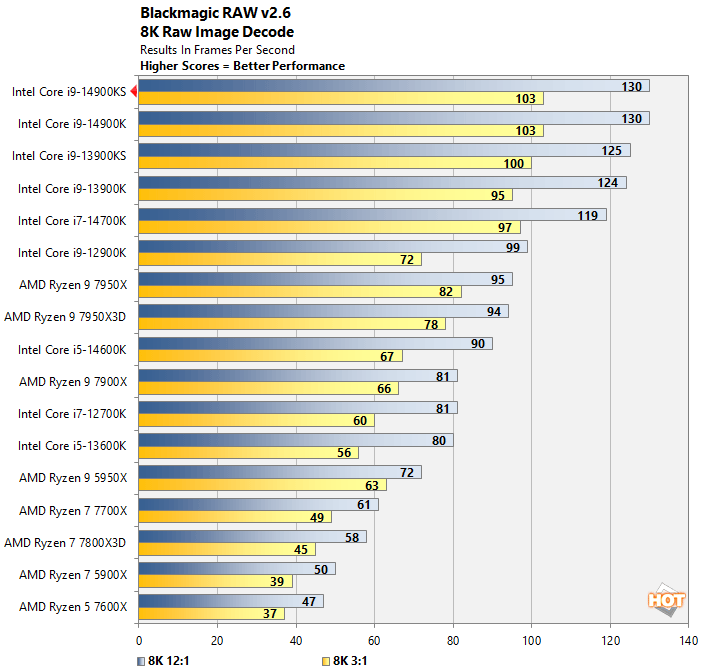
Blackmagic RAW Video Encoding Speed

The Blackmagic RAW Speed Test is a CPU and GPU benchmarking tool that tests full-resolution Blackmagic RAW video decode performance. The tool can be used to evaluate the performance at various resolutions and bitrates on the CPU or using OpenCL on a GPU. We're reporting two results here, both using 8K resolution, but at differing bitrates and compression levels.

blackmagic core i9 14900ks benchmarks

We saw more of the same in the Blackmagic RAW speed test. The Core i9-14900KS puts up better numbers than all of the previous-gen chips, but it put up the exact same score as the Core i9-14900K.

Cinebench R23 Rendering Benchmark

Cinebench rendering performance test based on Cinema 4D from Maxon. Cinema 4D is a 3D rendering and animation tool suite used by animation houses and producers like Sony Animation and many others. It's very demanding of system processor resources and can utilize any number of threads, which make is an excellent gauge of computational throughput. This is a multi-threaded, multi-processor aware benchmark that renders and animates 3D scenes and tracks the length of the entire process. The rate at which each test system was able to render the entire scene is represented in the graphs below.

cinebench core i9 14900ks benchmarks

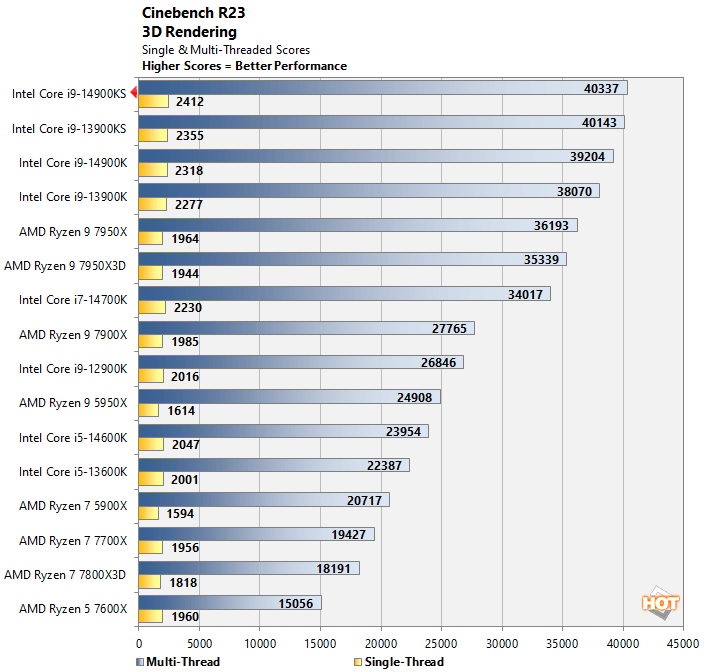
Like its immediate predecessor, the Core i9-14900KS breaks the 40K barrier in Cinebench's multi-threaded test, and lands in the top spot. The Core i9-14900KS also offered the best single-threaded score of the group by a comfortable margin.

POV-Ray CPU Ray Tracing Benchmark

POV-Ray, or the Persistence of Vision Ray-Tracer, is an open source tool for creating realistically lit images. We tested with POV-Ray's standard 'one-CPU' and 'all-CPU' benchmarking tools on all of our test machines and recorded the scores reported for each. Results are measured in pixels-per-second throughput; higher scores equate to better performance.

povray core i9 14900ks benchmarks

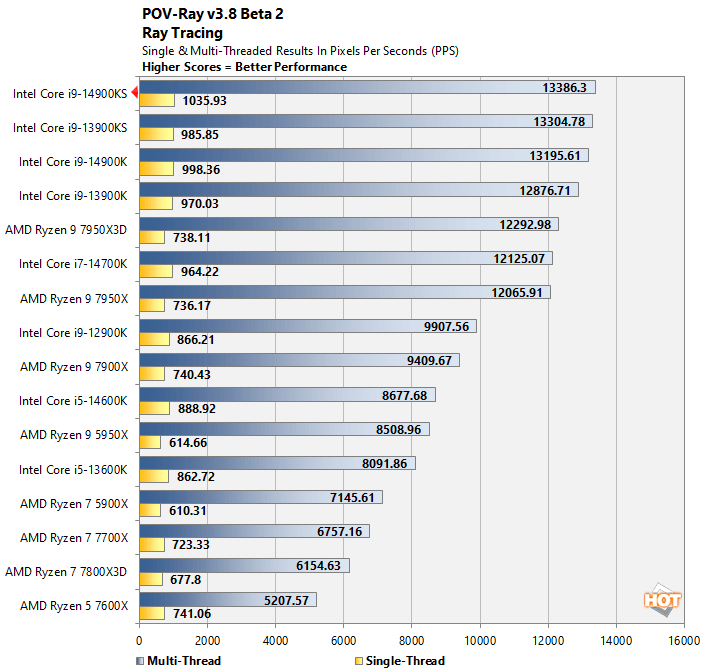
POV-Ray's results look very much like Cinebench. The Core i9-14900KS scores another pair of victories, besting all of the other processors in both the single and multi-threaded tests.

Blender Rendering Benchmarks

Blender is a free and open source 3D creation suite that can handle everything from modeling, rigging, and animation to simulation, rendering, compositing and motion tracking. It has a purpose-built benchmarking tool that will track the time it takes to complete rendering a particular model (or models). We used the CPU-focused benchmark with all three models currently available...

blender core i9 14900ks benchmarks

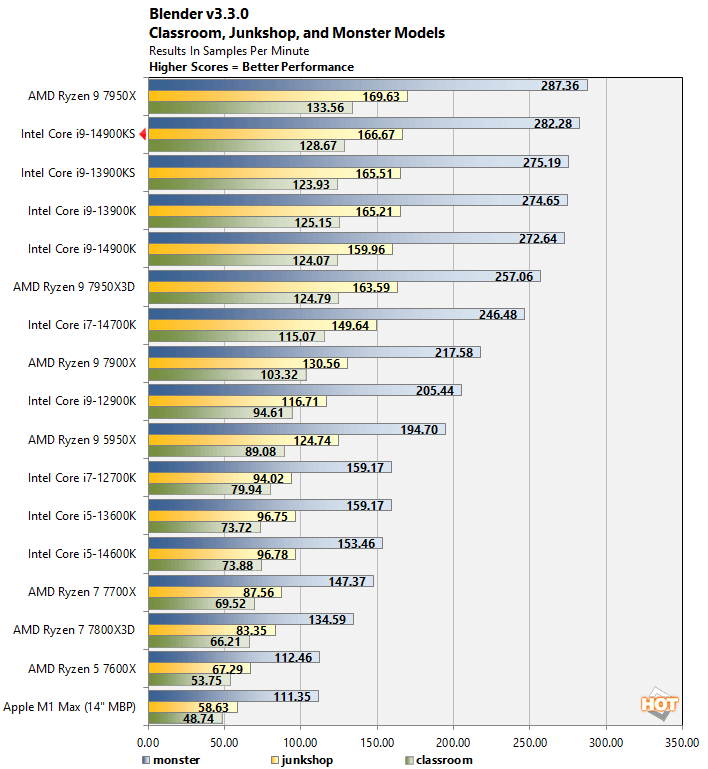
The heavily threaded, modern workloads of Blender push all of the P-cores on the Core i9-14900KS to their limit, and as a result, it performs right on top of the Core i9-13900KS. AMD's current flagship Ryzen 9 7950X takes the overall lead here, however.

Y-Cruncher Multi-Threaded Pi Calculator

Y-Cruncher is a multi-core-capable tool that calculates the value of pi to a specified number of digits. In this case, we ran the tool on all threads and had the application calculate the value of pi to 1 billion digits. The values below are the time required to perform the calculation expressed in seconds. As a result, lower values indicate better performance.

ycruncher core i9 14900ks benchmarks

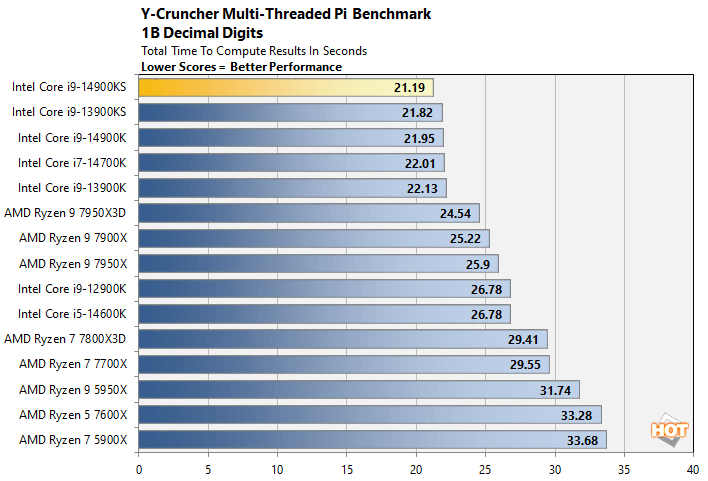
The Core i9-14900KS finishes in first place yet again, albeit by a very small margin versus the previous gen Core i9-13900KS. AMD's top-end chip, however, finishes a few seconds behind.

STARS Euler3d Multi-Threaded CFD Benchmark

STARS Euler3d is a computational fluid dynamics benchmark which uses a CFD grid that contains 1.23 million tetrahedral elements and 223 thousand nodes. The benchmark executable advances a mach 0.50 Advisory Group for Aerospace Research, or AGARD, flow solution for an aeroelastic test wing. The benchmark score is reported as a CFD cycle frequency in Hertz.


This benchmark is multi-threaded, but is also dependent on platform bandwidth, and cache and memory latency, so the final results are not determined by compute performance alone. Cache sizes / speed and memory bandwidth affect the score as well...

cfd core i9 14900ks benchmarks

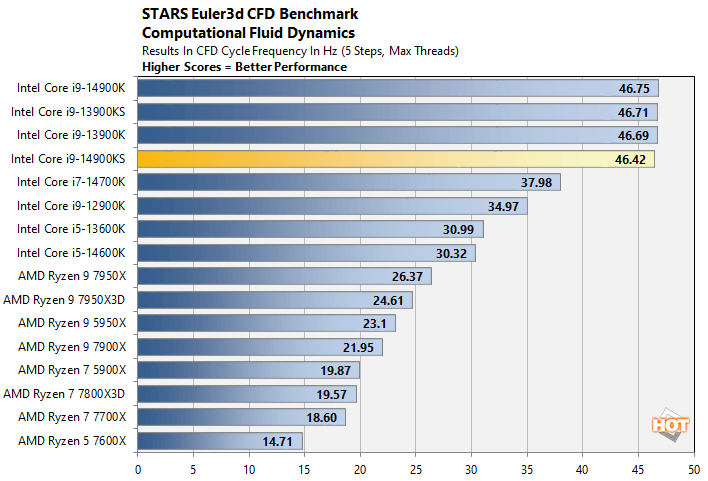
This benchmark runs exceptionally well on Intel's Raptor Lake-S based processors, thanks to their larger caches, high-clocks, and increased memory bandwidth. While all of Intel's top-end processor populate the top of the chart, the Core i9-14900KS technically trails some of its siblings by a small margin. This kind of delta is just statistical noise in this aging benchmark, however.

Related content