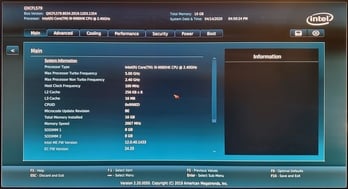
Like previous-gen NUCs (and high-end Intel motherboards from years past), the Ghost Canyon NUC 9 Extreme feature Intel’s Visual BIOS. The layout and graphics have been refreshed and updated somewhat in comparison to last year’s
Hades Canyon, but the overall aesthetic and functionality is similar. Intel’s Visual BIOS can be navigated using either a mouse or keyboard (or touch if you’ve got a compatible display), and is home to array of information about the processor and memory configuration, as well as other system specifics and hardware-health data.
 Intel NUC 9 Extreme Ghost Canyon BIOS Menus
All of the integrated peripherals can be enabled / disabled in the Visual BIOS, fan curves can be tweaked, should you want to micro-manage temperatures and acoustics, and there are a handful of power-related options available, should you want to fine tune the system’s power characteristics, and ultimately its performance. For our testing, we left the
BIOS at its out-of-box defaults, which has max performance mode enabled. For all intents and purposes, the
Ghost Canyon NUC 9 Extreme’s BIOS is designed for enthusiasts and it mimics what Intel used to offer in its full-sized HEDT motherboards, minus a few more advanced overclocking related options.
Because the NUC 9 Extreme is powered by a mix of mobile and desktop hardware, and it is a small form factor system as well, figuring out exactly where it fits in terms of performance present some challenges. As such, we decided to compare its performance to an array of mobile, desktop, and previous-gen NUCs, to paint as clear a picture as possible...
|
| Speedometer Web Application Benchmark |
| Browser Performance |
|
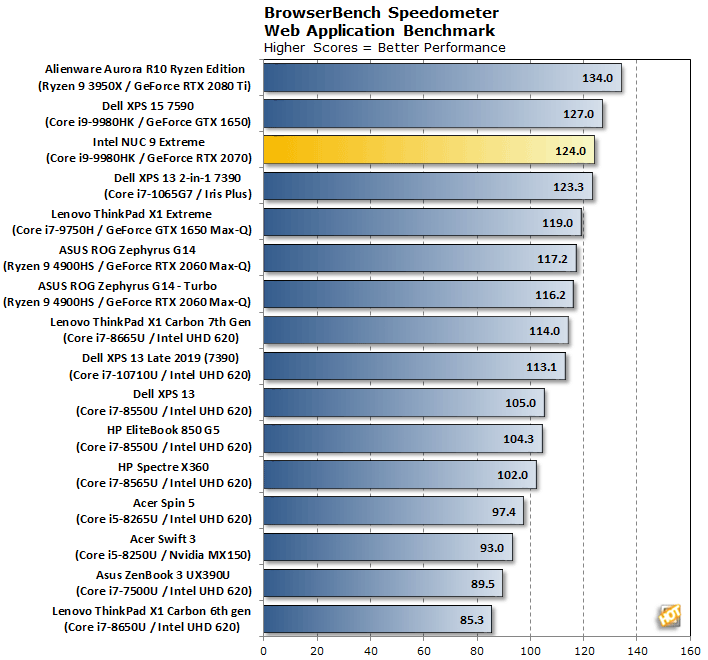
We recently moved on to BrowserBench.org's
Speedometer test, which takes a holistic look at web application performance. This test automatically loads and runs several sample webapps from ToDoMVC.com using the most popular web development frameworks around, including React, Angular, Ember.js, and even vanilla JavaScript. This test is a better example of how systems cope with real web applications, as opposed to a pure JavaScript compute test like JetStream. All tests were performed using the latest version of Chrome.
The NUC 9 Extreme, with its Core i9-9980HK and GeForce RTX 2070, powered through the Speedometer benchmark, and landed near the top of the charts. Only two machines scored higher -- a Dell XPS 15 laptop featuring a similar processor and a high-end Alienware desktop system with a Ryzen 9 3950X.
|
Cinebench R15 And R20
|
3D Rendering On The CPU And GPU
|
|
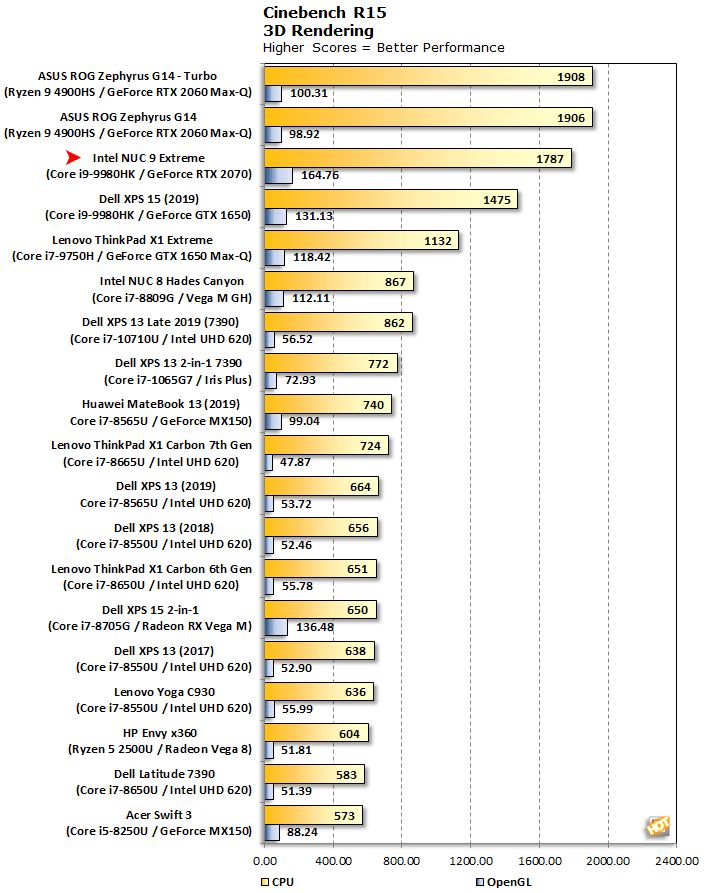
Cinebench tests the CPU and GPU independently and provides a glimpse into the system's throughput. The tests are based on Maxon’s Cinema 4D modeling software that’s used in movie production studios. The older R15 version of the benchmark has an OpenGL graphics test built-in, while the more taxing and new R20 version is solely a CPU test...
The NUC 9 Extreme put up some strong numbers in Cinebench R15. In the OpenGL test, the system's GeForce RTX 2070 offered the best score of the group. And in the multi-threaded CPU portion of the benchmark, the NUC 9 Extreme finished just behind the Ryzen 9 4900HS. Perhaps the most interesting data point is the comparison to the Dell XPS just below the NUC 9 Extreme in the charts. Although that notebook is powered by the same processor, that same processor isn't as thermally constrained in the NUC 9 Extreme and it puts up a much better score.
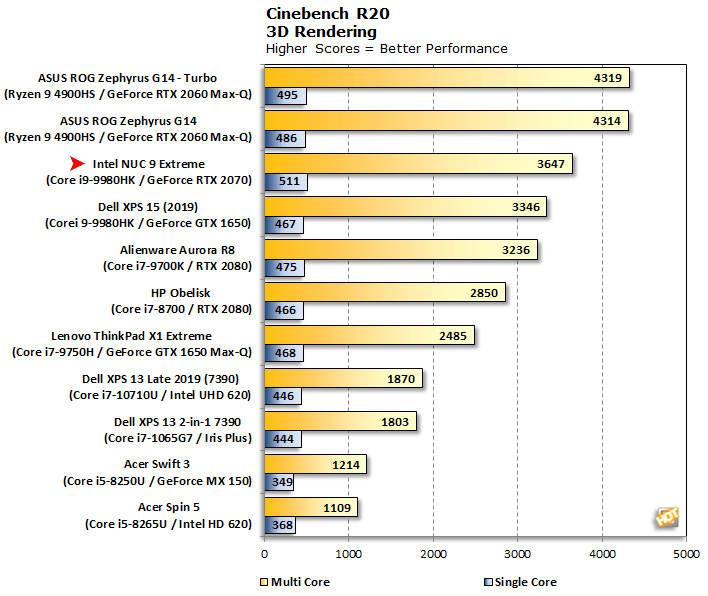
We saw more of the same in
Cinebench R20. Here, the NUC 9 Extreme managed the best single-threaded score of the group, and one of the better multi-threaded scores. Once again we see the NUC 9 Extreme's Core i9-9980HK clearly overpowering the same processor when in it's installed in a notebook form factor.
|
Geekbench
|
Single and multi-core
|
|
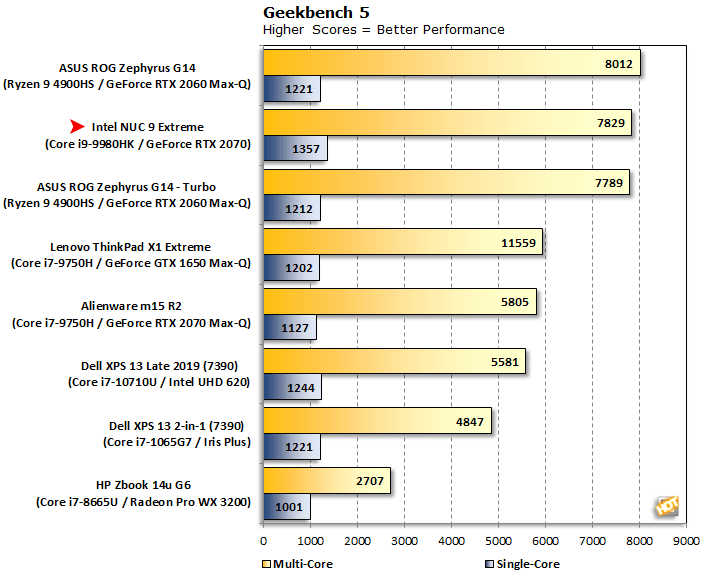
Geekbench 5 is a cross-platform benchmark that simulates real world processing workloads in image processing and particle physics scenarios. We tested the ROG Zephyrus G14 with Geekbench 5’s single and multi-core test workloads.
This is about as tight a race as you're going to see. In Geekbench 5, the NUC 9 Extreme lands smack dab in between the Ryzen 9 4900HS-powered ASUS ROG Zephyrus G14, depending on which power mode is being used -- at least in the multi-threaded test. In the single-threaded test, the NUC 9 Extreme offered the best score overall.
Futuremark benchmarks have been popular go-to system level tests since the late ‘90s. We ran the NUC 9 Extreme through PCMark 10, which is designed to gauge the system's performance in common, everyday computing tasks with GPU acceleration-enabled, and with 3DMark tests on the next page to assess its graphics and gaming chops.
|
PCMark 10
|
Productivity and System-Level Benchmarking
|
|
In PCMark 10, the NUC 9 Extreme leads the pack in this general purpose productivity and content creation benchmark. The mini system's strong single-threaded performance, in conjunction with its relatively powerful GeForce RTX 2070, and speedy storage subsystem propel it into the lead over all of the notebooks, desktops, and previous-gen NUCs for which we had comparison data.