Kingston DC1000M SSD Review: Big, Fast NVMe Storage
Kingston DC1000M: Large Capacity Data Center-Targeted NVMe Storage

Kingston recently released its DC1000M series of solid-state drives for data center applications, capped off by a massive 7.68TB model. The DC1000M series leverages a hot-pluggable U.2 (2.5”, 15mm) form factor, that’s compatible with U.2 backplanes and the drives target mixed-use, data-intensive workloads, including Cloud computing, web hosting, high-performance computing (HPC), virtual infrastructures, and AI and deep learning applications.
There are four drives in the initial Kingston DC1000M family, bookended by a 960GB model and the aforementioned 7.68TB behemoth. We’ve got a 3.84TB model on hand, which we’ll be showing you here. If you peruse the drives’ main features and specifications below, you’ll see very little separates the drive models, save for differing write speeds and IO performance. Take a peek for yourself and then we’ll dig in a little deeper and see how the Kingston DC1000M performs in comparison to a couple of its peers...

|
| Form factor | U.2, 2.5” x 15mm |
| Interface | PCIe NVMe Gen3 x4 |
| Capacities | 960GB, 1.92TB, 3.84TB, 7.68TB |
| NAND | 3D TLC |
| Sequential read/write | 960GB – 3,100MBs/1330MBs 1.92TB – 3,100MBs/2600MBs 3.84TB – 3,100MBs/2700MBs 7.68TB – 3,100MBs/2800MBs |
| Steady-state 4k read/write | 960GB – 400,000/125,000 IOPS 1.92TB – 540,000/205,000 IOPS 3.84TB – 525,000/210,000 IOPS 7.68TB – 485,000/210,000 IOPS |
| Latency | TYP read/write: <300 µs / <1 ms |
| Static and dynamic wear levelling | Yes |
| Power loss protection (power caps) | Yes |
| Enterprise SMART tools | Reliability tracking, usage statistics, SSD life remaining, wear leveling, temperature |
| Endurance | 960GB — 1681TBW (1 DWPD/5yrs) 1.92TB — 3362TBW (1 DWPD/5yrs) 3.84TB — 6725TBW (1 DWPD/5yrs) 7.68TB — 13450TBW (1 DWPD/5yrs) |
| Power consumption | 960GB: Idle: 5.14W Average Read: 5.25W Average Write: 9.10W Max Read: 5.64W Max Write: 9.80W 1.92TB: Idle: 5.22W Average Read: 5.31W Average Write: 13.1W Max Read: 5.70W Max Write: 13.92W 3.84TB: Idle: 5.54W Average Read: 5.31W Average Write: 14.69W Max Read: 6.10W Max Write: 15.5W 7.68TB: Idle: 5.74W Average Read: 5.99W Average Write: 17.06W Max Read: 6.63W Max Write: 17.88W |
| Storage / Operating Temperature | -40°C ~ 85°C / 0°C ~ 70°C |
| Dimensions / Weight | 100.09mm x 69.84mm x 14.75mm / 160(g) |
| Vibration operating / non-operating | 2.17G peak (7-800Hz) / 20G peak (10-2,000Hz) |
| MTBF | 2 million hours |
| Warranty / support | Limited 5-year warranty with free technical support |
Kingston DC1000M SSDs feature 96-layer 3D NAND flash memory, a native NVMe PCI Express Gen 3.0 x4 interface and offer read speeds north of 3.1GB/s, with writes ranging from 1.33GB/s for the 960GB model to the 2.8GB/s for the top-end 7.78TB drive. The 3.84TB drive we evaluated isn’t too far behind at 2.7GB/s.


Our Test Methods: Under each test condition, the SSDs tested here were installed as secondary volumes in our testbed, with a separate drive used for the OS and benchmark installations. Our testbed's motherboard was updated with the latest BIOS available at the time of publication and drives were left blank without partitions for some tests, while others required them to be partitioned and formatted, as is the case with the ATTO, SANDRA, and CrystalDiskMark tests. Windows firewall, automatic updates, and screen savers were all disabled before testing and Windows 10 Quiet Hours / Focus Assist was enabled to prevent any potential interruptions.

|
| Processor - Motherboard - Video Card - Memory - Audio - Storage - |
AMD Ryzen Threadripper 3990X MSI TRX40 Creator (TRX40 Chipset) GeForce RTX 2080 Ti 32GB G.SKILL DDR4-3200 Integrated on board Corsair MP600 (1TB) - OS Drive Samsung SSD 983 DCT (1.92TB) Intel SSD DC4510 (2TB) Kingston DC1000M (3.84TB) |
OS - Chipset Drivers - DirectX - Benchmarks - |
Windows 10 Pro x64 (1v909) AMD v2.04.28.626 DirectX 12 IOMeter 1.1 HD Tune v5.75 ATTO v4.01.0f2 AS SSD CrystalDiskMark v7 x64 SiSoftware SANDRA 2020 |
|
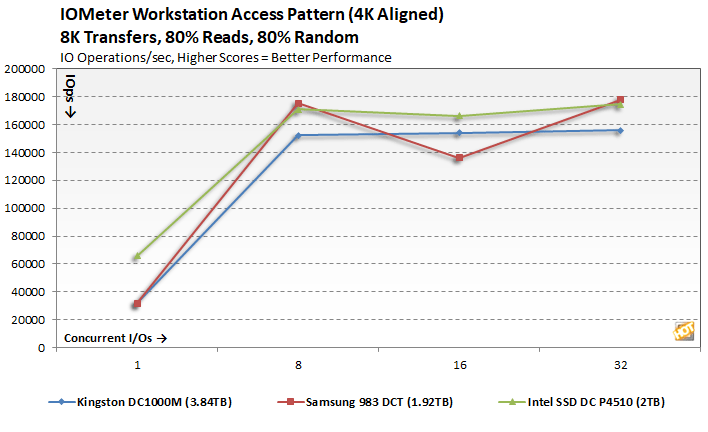
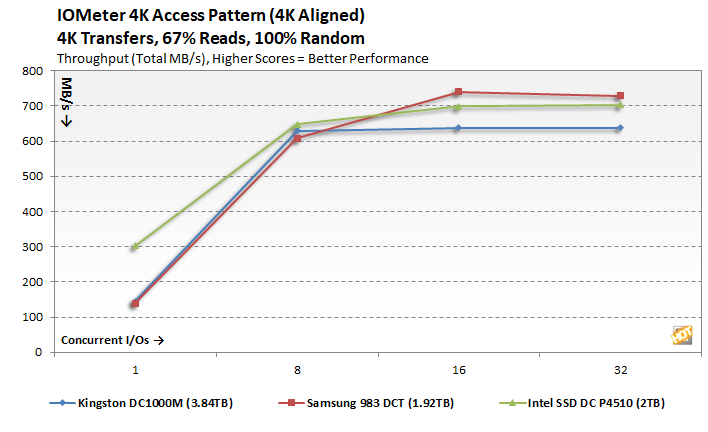
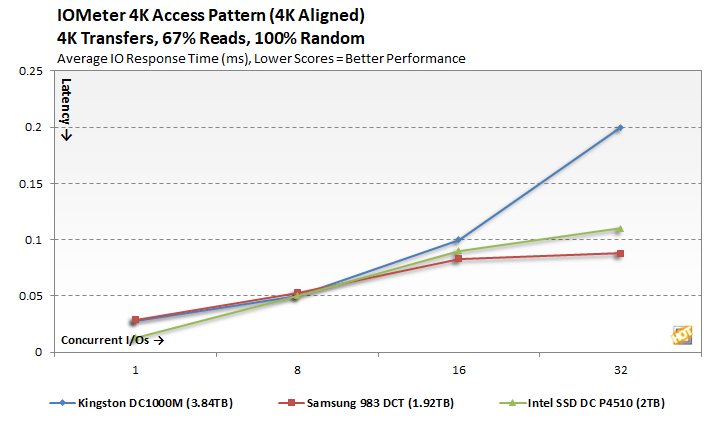
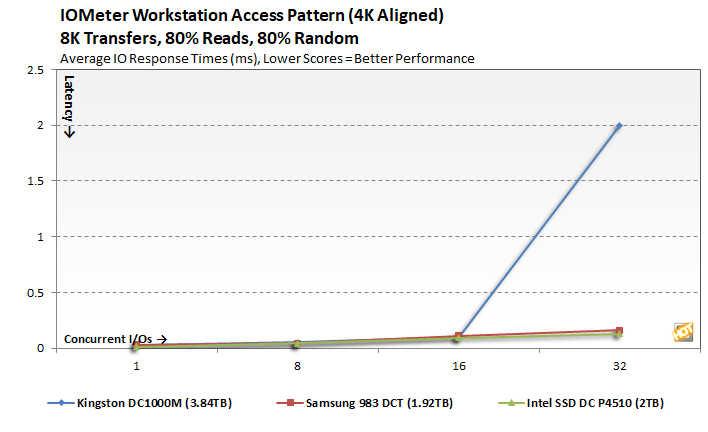
In the following tables, we're showing two sets of access patterns; a custom Workstation pattern, with an 8K transfer size, consisting of 80% reads (20% writes) and 80% random (20% sequential) access and a 4K access pattern with a 4K transfer size, comprised of 67% reads (33% writes) and 100% random access. Queue depths from 1 to 32 were tested...


|
ATTO is straightforward disk benchmark that measures transfer speeds across a specific volume length. It measures raw transfer rates for both reads and writes and graphs them out in an easily interpreted chart. We chose .5KB through 64MB transfer sizes and a queue depth of 6 over a total max volume length of 256MB. ATTO's workloads are sequential in nature and measure raw bandwidth, rather than I/O response time, access latency, etc.
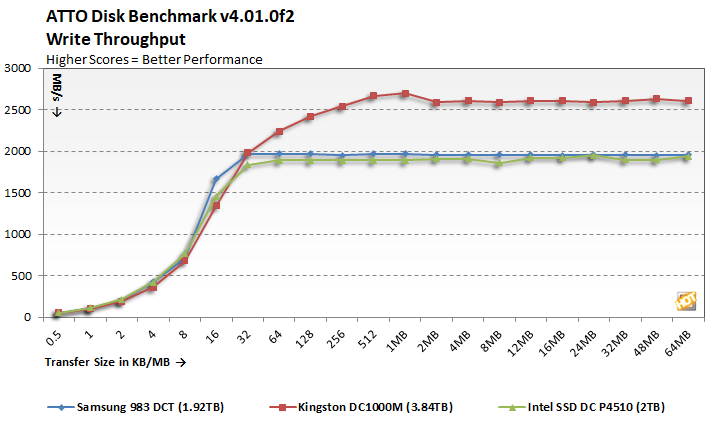
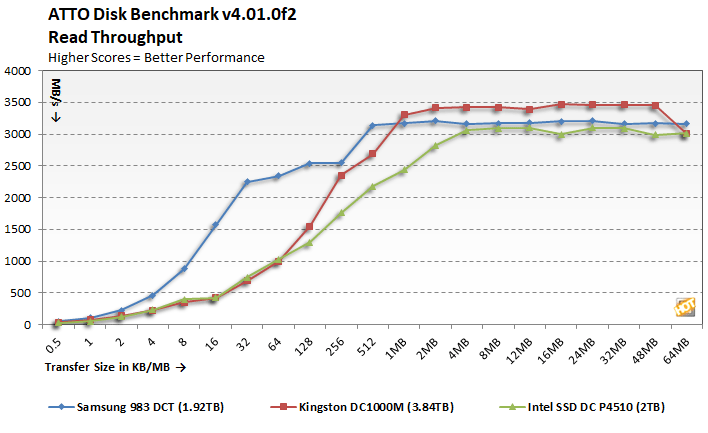
In terms of overall throughput, the Kingston DC1000M leads the pack according to ATTO, in both the read and write tests, once it hits the larger transfer sizes. Samsung's drive is optimized for read performance at the smaller block sizes, but Kingston ends up in the lead once the drive hit the 1MB mark.
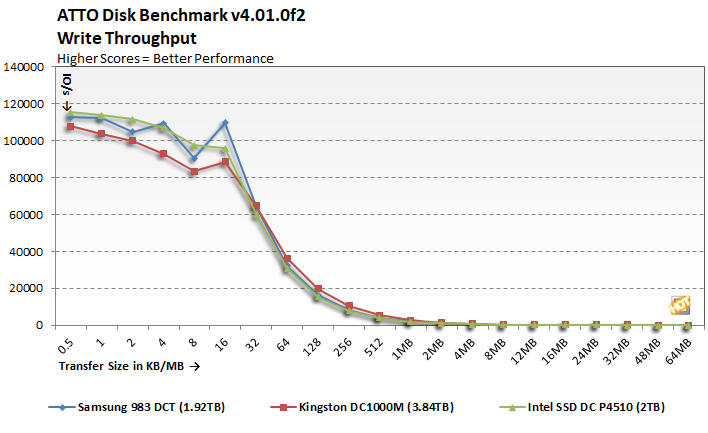
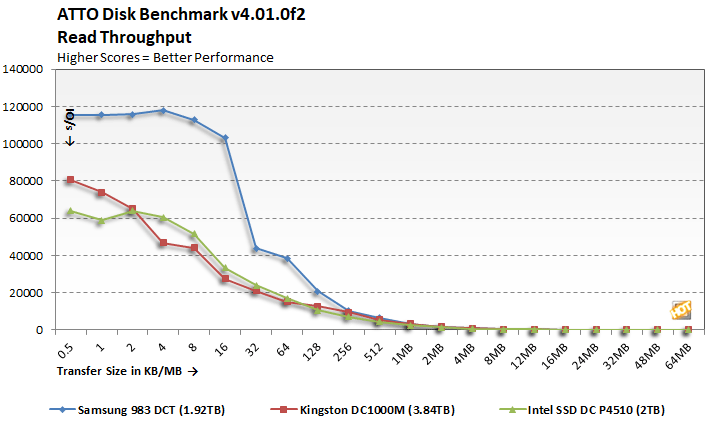
Peak IOs also look fairly different across the drives. All of the drives represented here flatlined at about the 1MB transfer size, but with smaller transfers there are clear deltas separating them all. The Samsung 983 DCT drive offered clearly superior read performance, while the Intel and Kingston drives battle it out depending on the transfer size.


