Kingston DC1500M SSD Review: High Endurance NVMe Storage
Kingston DC1500M: High-Performance, High-Capacity NVMe Storage

There are four drives in the initial Kingston DC1500M SSD line-up, starting with a 960GB model and maxing out with a beefy 7.68TB behemoth. We’ve got a 1.92TB model on hand for testing, which we’ll be showing you here. If you check out the drives’ main features and specifications below, you’ll notice that not much separates the various drive models in the DC1500M series, save for differing write speeds and IO performance, depending on the capacity. Take a look for yourself and then we’ll dig in a little deeper and see how the Kingston DC1500M performs in comparison to a handful of its peers...
Kingston DC1500M SSD: Specifications & Features
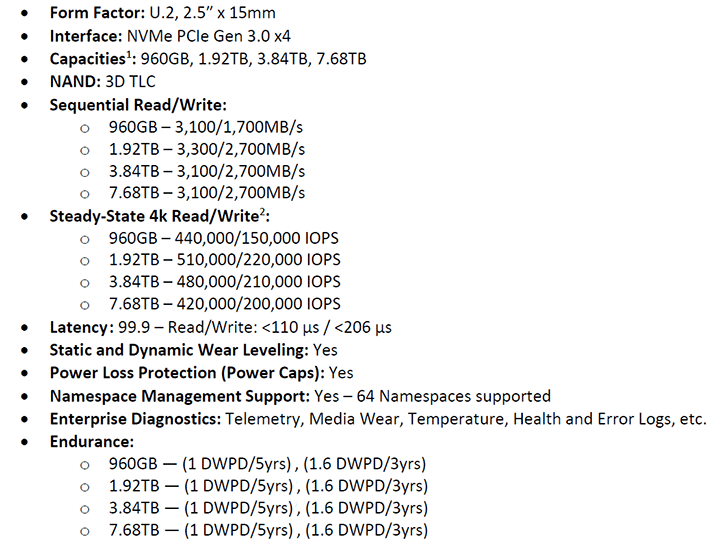
Kingston DC1500M SSDs feature 3D TLC NAND flash memory and a Silicon Motion SM2270 16-channel enterprise controller, with a native NVMe PCI Express Gen 3.0 x4 interface. The drives offer read speeds north of 3.1GB/s (or 3.3GB/s for the 1.92TB model), with writes ranging from 1.7GB/s for the 960GB model to the 2.7GB/s for the three higher-capacity models, including the 1.92TB drive we’ll be testing.


Kingston DC1500M Test Setup And Benchmarks
Under each test condition, the SSDs tested here were installed as secondary volumes in our testbed, with a separate drive used for the OS and benchmark installations. Our testbed's motherboard was updated with the latest BIOS available at the time of publication and Windows firewall, automatic updates, and screen savers were all disabled before testing. Windows 10 Quiet Hours / Focus Assist was also enabled to prevent any potential interruptions.

HotHardware's Test System:
| Processor: AMD Threadripper 3990X Motherboard: MSI TRX40 Creator (TRX40 Chipset) Video Card: GeForce RTX 2080 Ti Memory: 32GB G.SKILL DDR4-3200 Storage: Corsair MP600 (OS Drive) Samsung SSD 983 DCT (1.92TB) Intel SSD DC4510 (2TB) Intel SSD DCP4600 (2TB) Intel SSD D7-P5510 (7.68TB) Kingston DC1000M (3.84TB) Kingston DC1500M (1.92TB) |
OS: Windows 10 Pro x64 Chipset Drivers: AMD v2.07.14.327 Benchmarks: IOMeter HD Tune v5.75 ATTO v4.01.0f AS SSD SiSoftware SANDRA CrystalDiskMark v8 x64 Custom Latency Under Load |
IOMeter Benchmarks
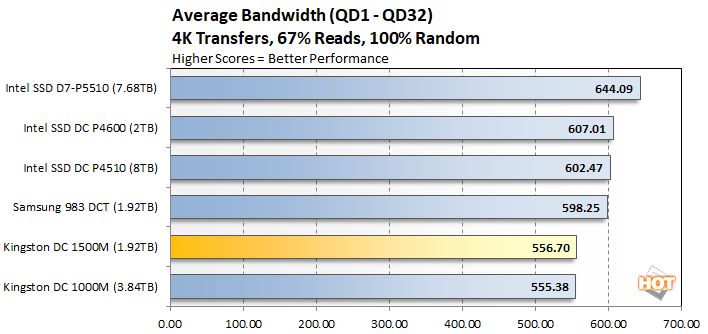
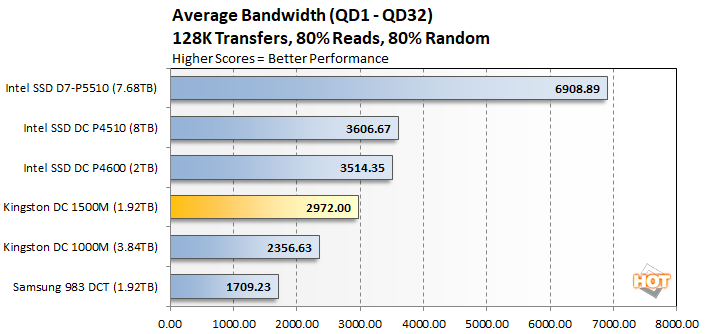
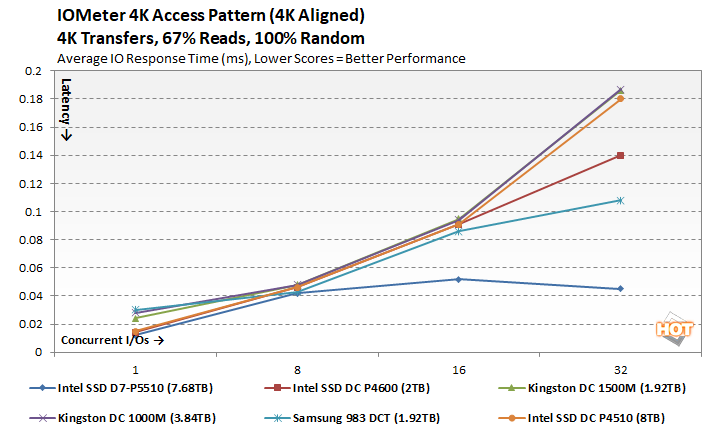
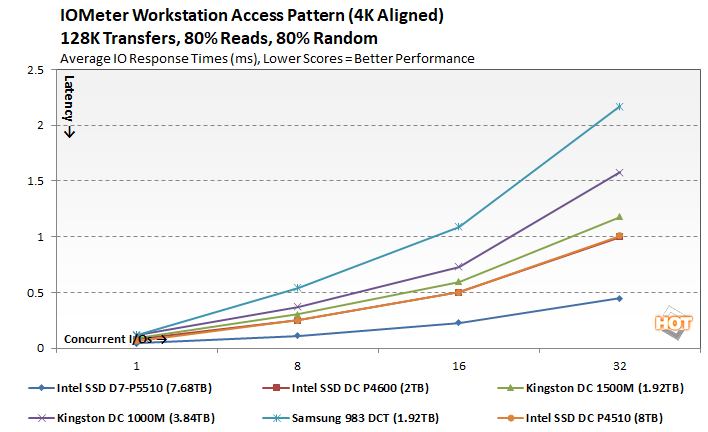
As we've noted in previous SSD articles, though IOMeter is clearly a well-respected industry standard benchmark too, we're not completely comfortable with it for testing SSDs. The fact of the matter is, though our results with IOMeter appear to scale, it is debatable whether or not certain access patterns, as they are presented to and measured on an SSD, actually provide a valid example of real-world performance. The access patterns we tested may not reflect your particular workload, for example. That said, we do think IOMeter is a reliable gauge for relative available throughput, latency, and bandwidth with a given storage solution. In addition, there are certain higher-end workloads you can place on a drive with IOMeter, that you can't with most other storage benchmark tools available currently.In the following tables, we're showing two sets of access patterns; a custom Workstation pattern, with an 128K transfer size, consisting of 80% reads (20% writes) and 80% random (20% sequential) access and a 4K access pattern with a 4K transfer size, comprised of 67% reads (33% writes) and 100% random access. Queue depths from 1 to 32 were tested...
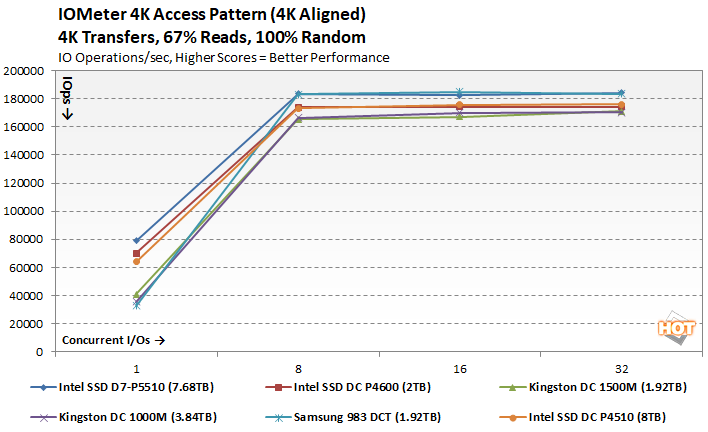
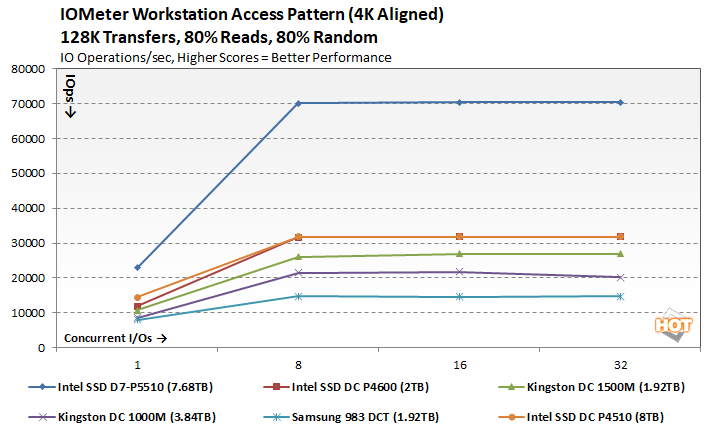
The new Kingston DC1500M finished about in the middle of the pack with both of the access patterns, versus the other PCIe Gen 3 drives we tested (the Gen 4 Intel SSD D7-P5510 finished well ahead of the Gen 3 drives).
ATTO Disk Benchmark
ATTO is straightforward disk benchmark that measures transfer speeds across a specific volume length. It measures raw transfer rates for both reads and writes and graphs them out in an easily interpreted chart. We chose .5KB through 64MB transfer sizes and a queue depth of 4 over a total max volume length of 256MB. ATTO's workloads are sequential in nature and measure bandwidth and IOs, rather than response times, access latency, etc.
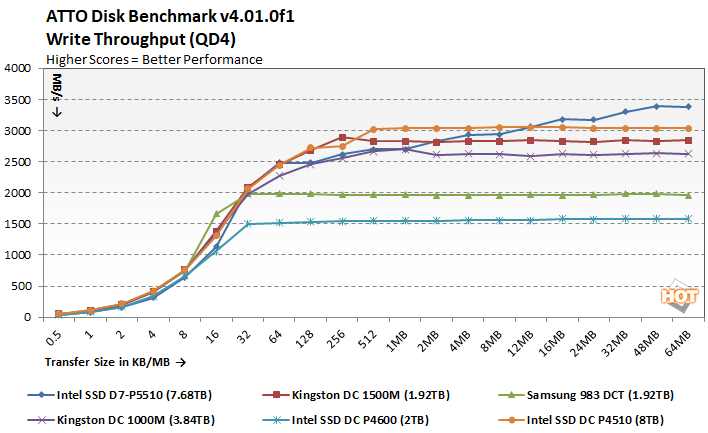
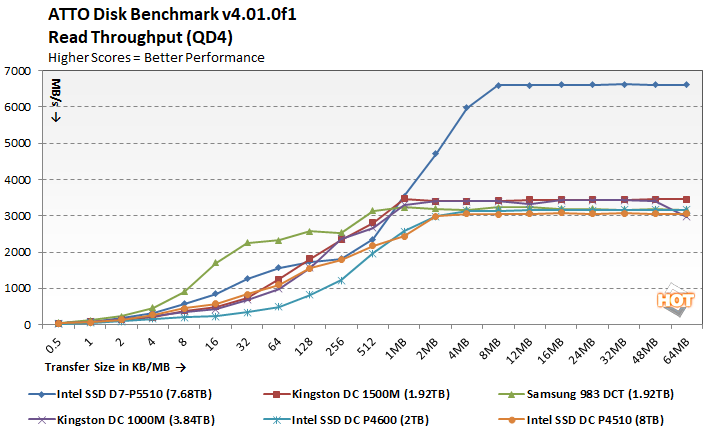
The Kingston DC1500M offered competitive read and write bandwidth across the board, in comparison to the other PCIe Gen 3 drives at least. The PCIe Gen 4 Intel drive ran away from the competition in the read test, however.
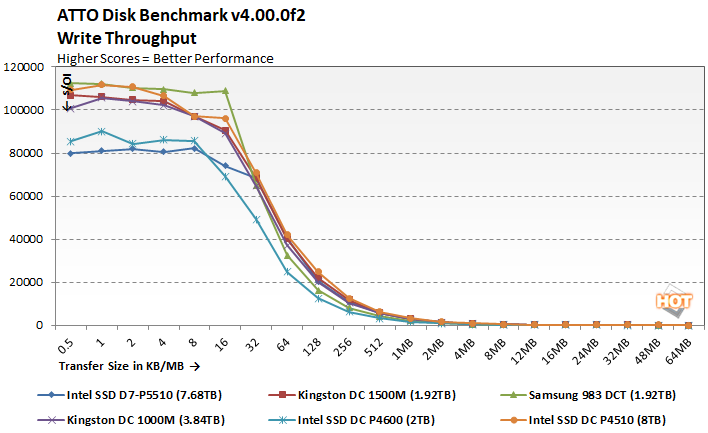
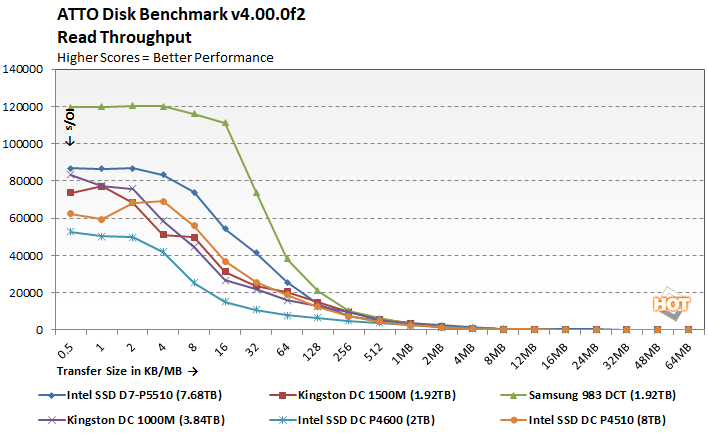
Peak IOs were also competitive for the Kingston DC1500M, and hovered around the middle of the pack in both the read and write tests.
SiSoft SANDRA 2021
Next we used SiSoft SANDRA, the the System ANalyzer, Diagnostic and Reporting Assistant for some quick tests. Here, we used the Physical Disk test suite and provide the results from our comparison SSDs. The benchmarks were run on clean drives that lacked any partitions. Read and write performance metrics are detailed below.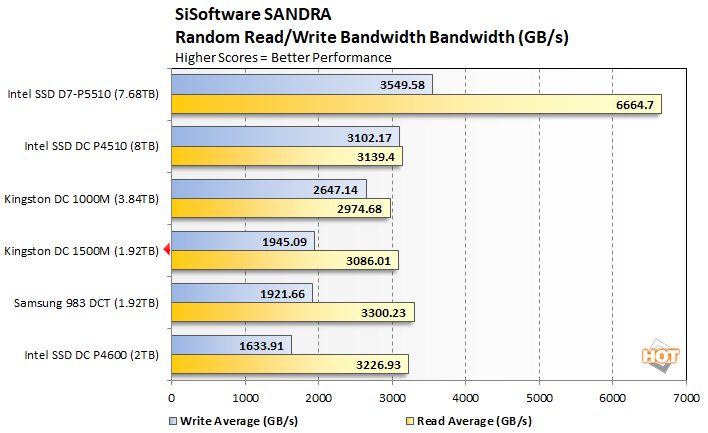
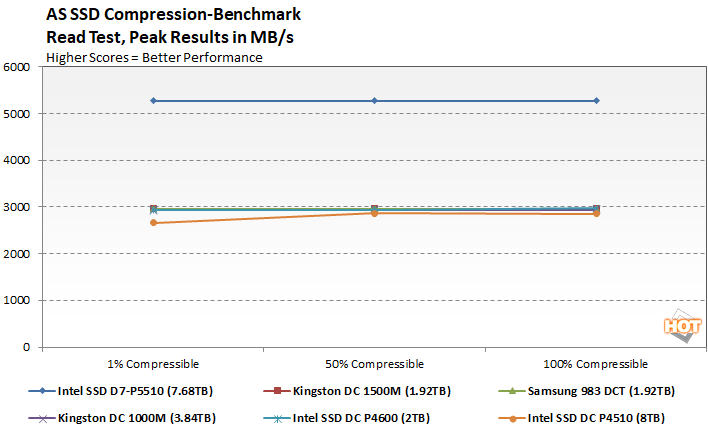
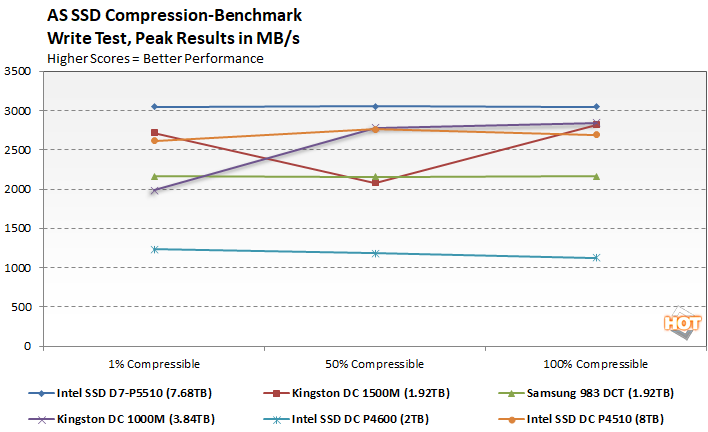
AS SSD Compression Benchmark
Next up we ran the Compression Benchmark built-into AS SSD, an SSD specific benchmark being developed by Alex Intelligent Software. This test is interesting because it uses a mix of compressible and non-compressible data and outputs both Read and Write throughput of the drive. We only graphed a small fraction of the data (1% compressible, 50% compressible, and 100% compressible), but the trend is representative of the benchmark’s complete results.