Lenovo ThinkPad P15 Gen 2 Review: Refined Mobile Workstation
by
Chris Goetting
—
Friday, November 12, 2021, 11:29 AM EDT
Lenovo ThinkPad P15 Gen 2: System Level And Gaming Benchmarks
Before we jump into benchmarks, we install the latest updates and drivers from Windows Update, the Windows Store, and Lenovo Vantage. We also double check to ensure the latest UEFI firmware is installed. We then install all the benchmark applications at once to minimize variability if tests need to be re-run, and finally turn off auto-updates for the duration of our testing. Before each test is run, the system is rebooted and allowed to settle into an idle state.
ATTO Disk Benchmark
The ATTO disk benchmark is a fairly quick and simple test which measures read/write bandwidth and IOPS across a range of different data sizes. While we don't typically compare these results across multiple machines, it's useful to gauge whether a particular notebook's storage subsystem can handle being put under pressure.
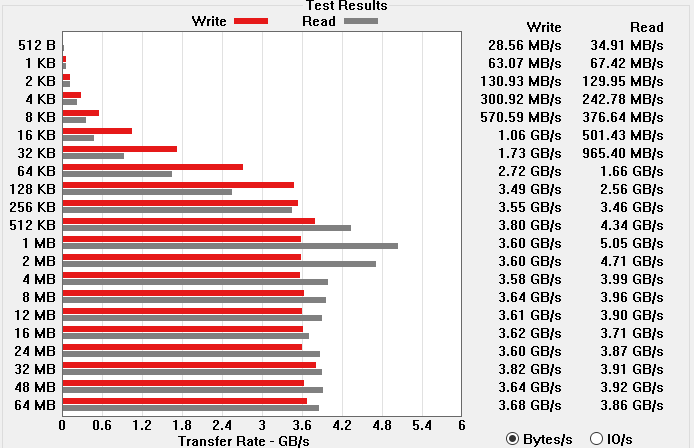
ATTO Queue Depth 4
With ATTO set to its default queue depth of 4, the system's KIOXIA drive delivers peak write speeds of about 3.8GB/s and read speeds just over 5.0 GB/s. These speeds are certainly within the envelope of Gen 4 performance, though we have seen faster drives in other systems.
What is often more telling about a drive is its performance at a queue depth of 1. In other words, how quickly can the drive record and retrieve data with no ability to plan ahead. Queue depth 1 tasks are often a better glimpse of general system responsiveness.
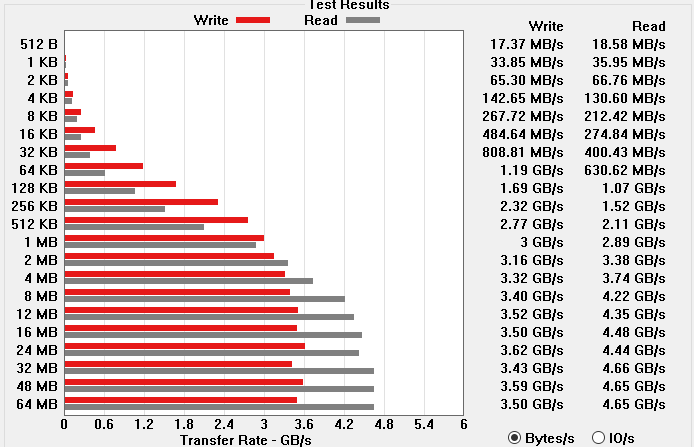
ATTO Queue Depth 1
Smaller transfer chunks are slower at queue depth 1, but at the higher end read and write speeds are pretty well preserved. In fact, the read speeds continue to improve beyond 1MB, and then from 8MB onwards actually outperforms the queue depth 4 run. In short, this demonstrates that the ThinkPad P15 Gen 2 remains quite responsive throughout on-demand storage tasks.
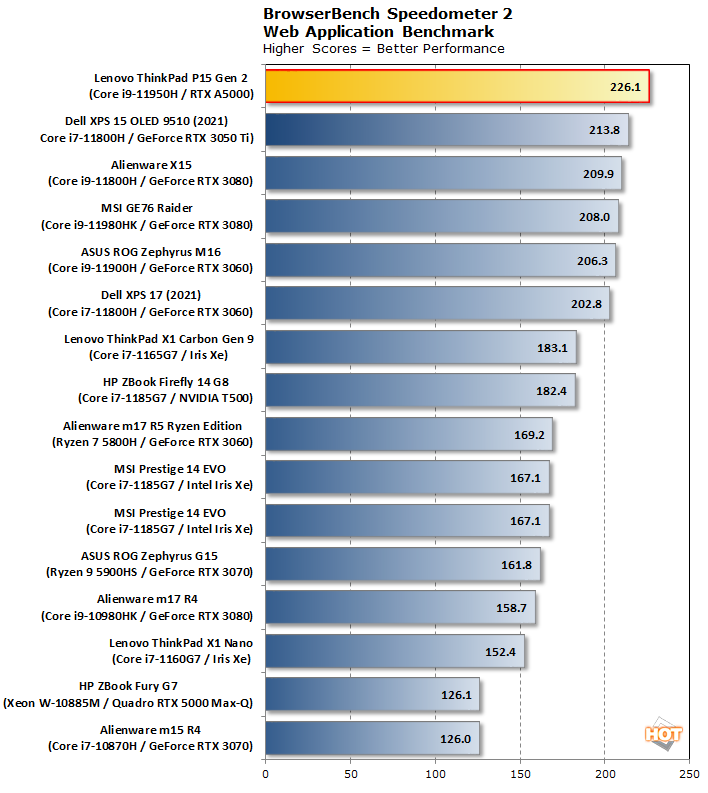
Speedometer Web Applications Benchmark
BrowserBench.org's Speedometer test takes a holistic look at web application performance. This test automatically loads and runs several sample webapps from ToDoMVC.com using the most popular web development frameworks around, including React, Angular, Ember.js, and even vanilla JavaScript. This test is a better example of how systems cope with real web applications, as opposed to a pure JavaScript compute test like JetStream. All tests were performed using the latest version of Chrome.
The Lenovo ThinkPad P15 Gen 2 indicates very strong system responsiveness in our Speedometer test. While this is not a brutal sustained workload by any measure, it does indicate regular simple tasks will be conducted fluidly and without issue.
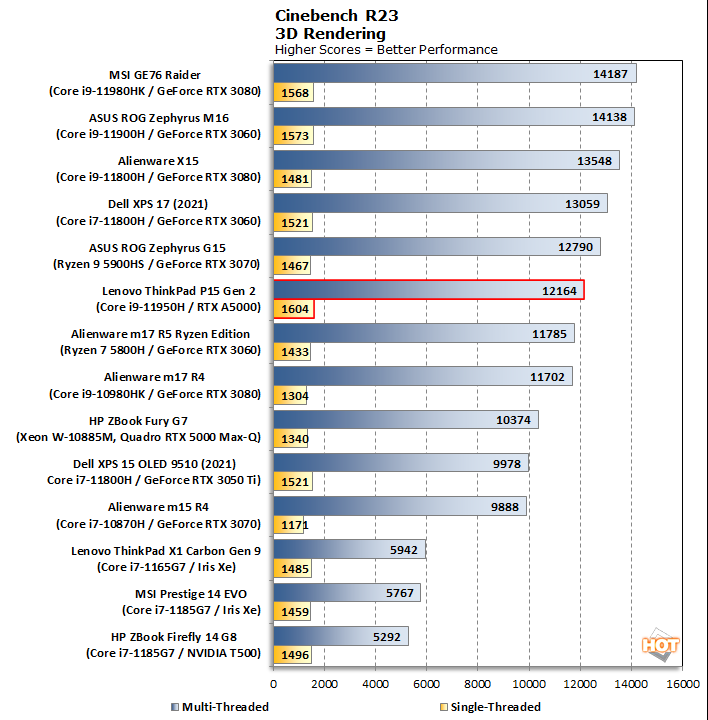
Cinebench Rendering Performance
The Cinebench rendering performance test is based on Cinema 4D from Maxon. Cinema 4D is a 3D rendering and animation tool suite used by animation houses and producers like Sony Animation and many others. It's very demanding of system processor resources and can utilize any number of threads, which make is an excellent gauge of computational throughput. The newest benchmark from Maxon, Cinebench R23, renders the same scene as R20 but with the company's latest rendering engine with support for all current-gen hardware.
Our test system delivers weaker than expected scores in Cinebench. As we allude to in our discussion on thermals on the next page, we have found this system starts thermal throttling almost immediately and never really recovers in the multi-threaded workload. Once the fans spin up, temperatures drop from 100°C to about 93°C, but clock frequencies don't recover. However, in the single-threaded workload the ThinkPad P15 is able to keep temperatures under control and is the only system to break 1600.
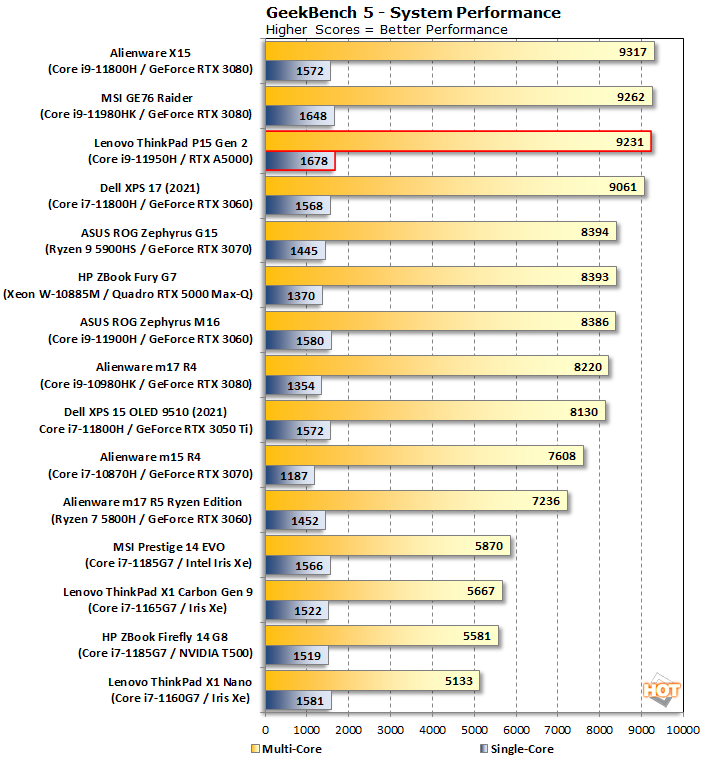
Geekbench General Purpose Compute Cross-Platform Benchmark
Geekbench is a cross-platform benchmark that simulates real world processing workloads in image processing and particle physics scenarios. We tested the notebooks featured here in Geekbench's single and multi-core workloads. We've retired Geekbench 4 because version 5 performs many of the same tests, which have been updated with the latest CPU architectures and features in mind.
Geekbench, by contrast, shows the ThinkPad P15 Gen 2 in a much more positive light. While it is outpaced in the multithreaded test by a Core i9-11800H in the form of the Alienware X15, it keeps within the margin of error. Again, the single-threaded workload really shines here and shows the strongest score of the pack.
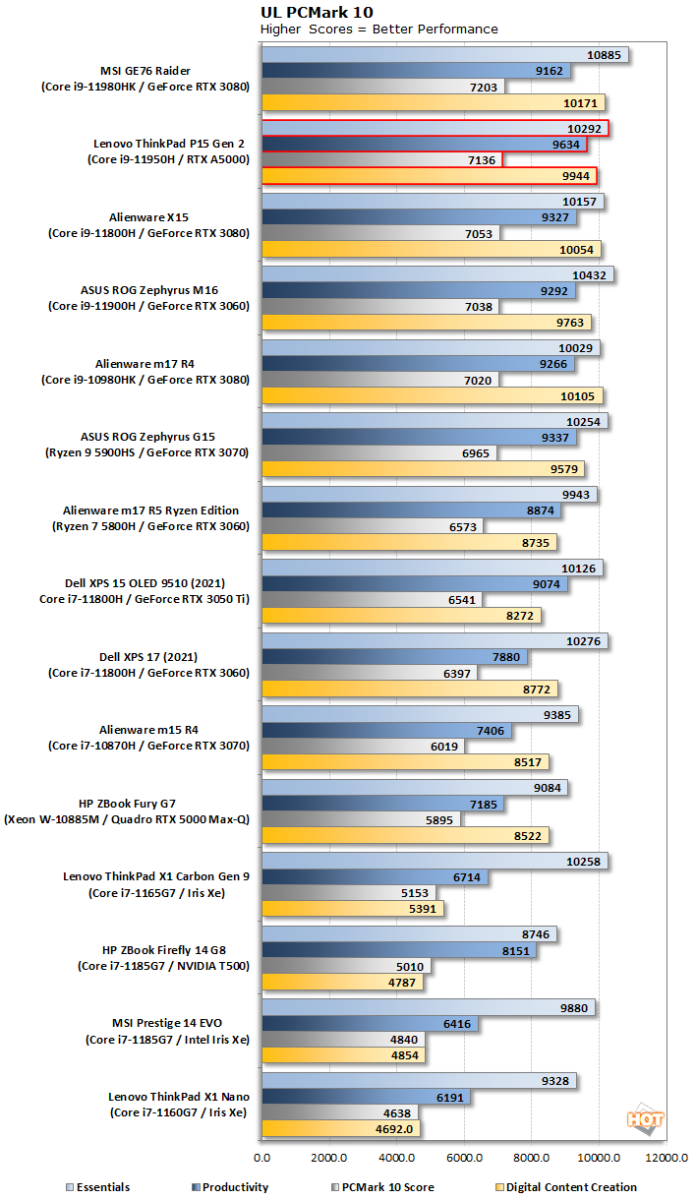
PCMark 10 Productivity and Content Creation Benchmarks
PCMark 10 uses a mix of real-world applications and simulated workloads to establish how well a given system performs productivity tasks, including image and video editing, web browsing, and OpenOffice document editing. While these scores appear to be all over the place, the systems are sorted by their overall PCMark score, which is the third (gray) bar in each cluster.
While stepping through PCMark 10's mix of applications, the ThinkPad P15 Gen 2 demonstrates suitably strong performance. In particular, its Productivity score is unparalleled by the competition. We do expect the professional class GPU to shrug off a small amount of performance in the Digital Content Creation workloads, but in return it does grant a higher degree of reliability. Completing a project marginally faster is small consolation when a wayward bit can send the whole thing right to the shadow realm.
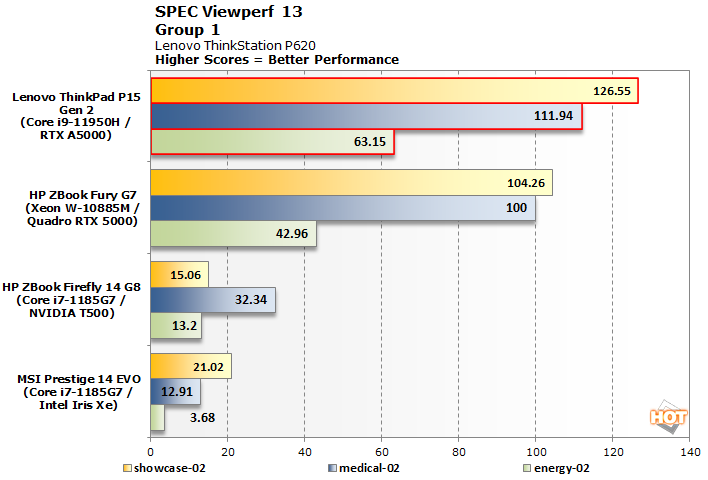
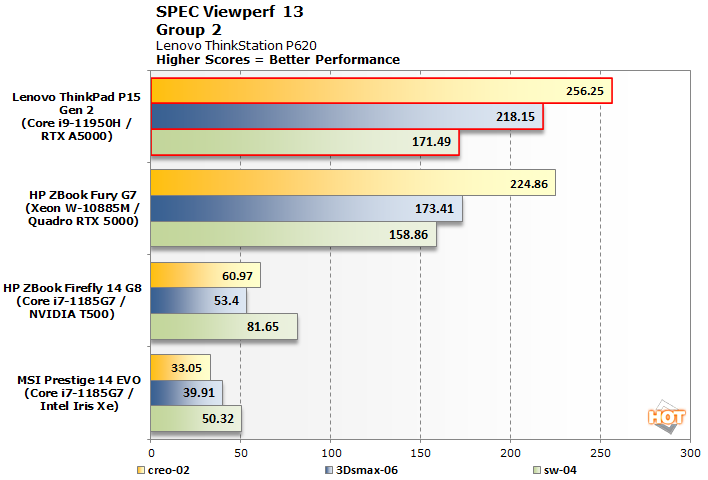
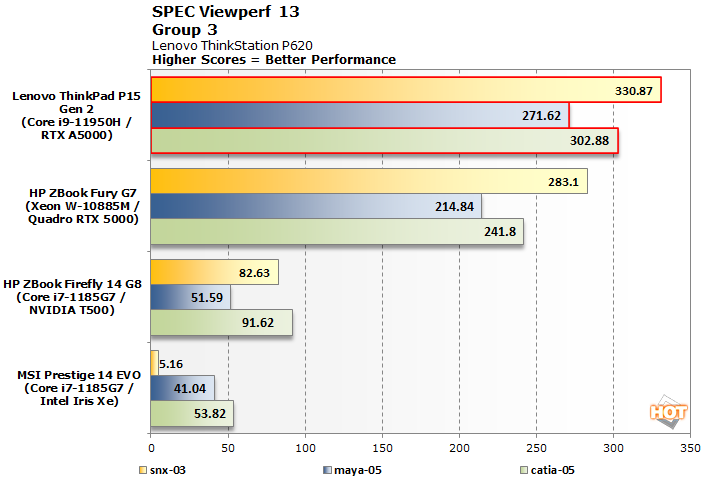
SPEC Viewperf 13 Professional Application Workloads
It is not very often that we get a mobile workstation with ISV-certified drivers through our offices, so there are not a lot of points of comparison. SPEC Viewperf 13 lets us see how a multitude of professional 3D apps would perform on the ThinkPad P15 Gen 2.
Amongst the competing Workstation class notebooks we have tested, the ThinkPad P15 Gen 2 has no equal. This is in part to be expected, as even the closest configuration in the HP ZBook Fury G7 is using prior-generation CPU and GPU solutions.
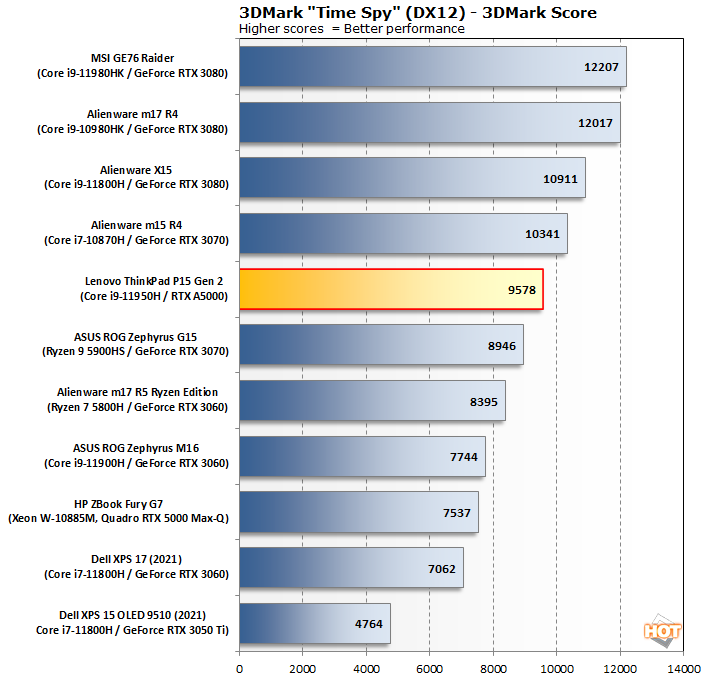
3DMark Synthetic DirectX Game Performance Testing
3DMark has several different graphics tests which focus on different types of systems. We start with Time Spy, which is 3DMark's headline benchmark. This test presents a pretty significant challenge for the system's CPU and GPU using DirectX 12's API...
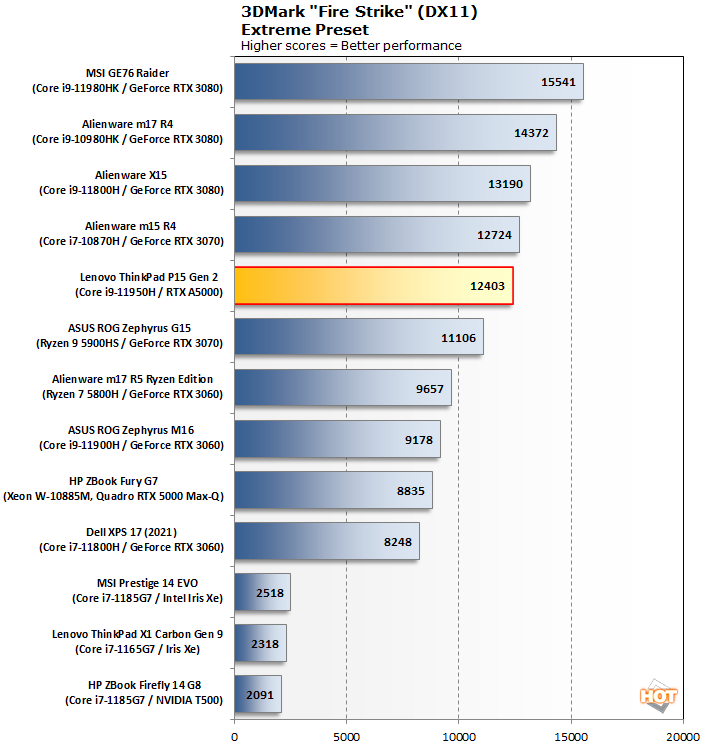
Next up, let's take a look at the Extreme preset for the punishing 3DMark Fire Strike test. This DirectX 11 test has been around for a while, but it's still pretty challenging.
Fire Strike maintains the same rank-order we saw with Time Spy. At least this time the gap between it and the Alienware X15 is closer to just 6%.
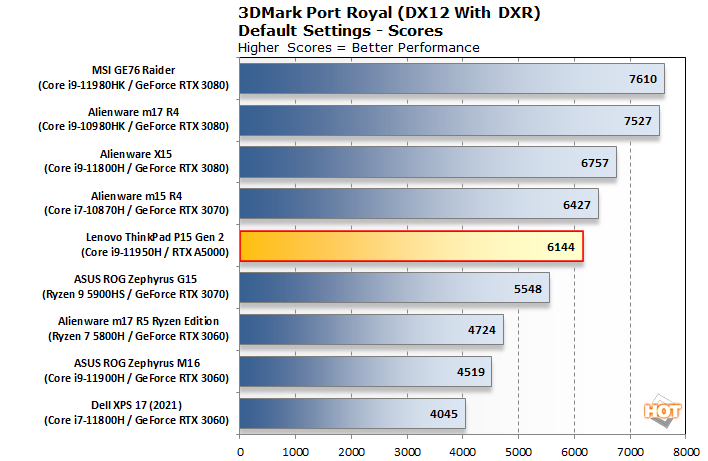
Lastly, the Port Royal test uses DirectX Ray Tracing (DXR) to illuminate a scene...
Port Royal completes our 3DMark trilogy with much the same story. While cut from the same silicon, the Lenovo ThinkPad P15 Gen 2's RTX A5000 is just not able to keep pace with its RTX 3080 counterparts. Part of this is due to its minimum TGP configuration, but not entirely seeing as the Alienware X15's RTX 3080 is similarly configured.
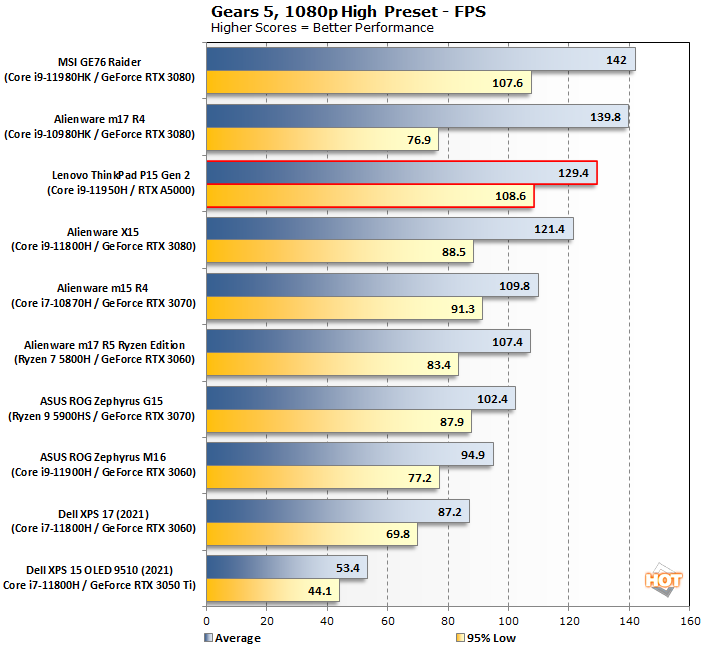
Gears 5 Game Benchmarks
Gears 5 was one of the fall blockbusters we had a chance to dig deeply into, and on top of looking great, it's a blast to play. We used the High image quality preset at 1920x1080, the same as before, to test this game benchmark.
In Gears 5, the RTX A5000 inside our system brings RTX 3080 class performance. While average framerates fall in the middle of that pack, it actually keeps the best minimum framerate of the bunch which is arguably more important to maintain smoothness.
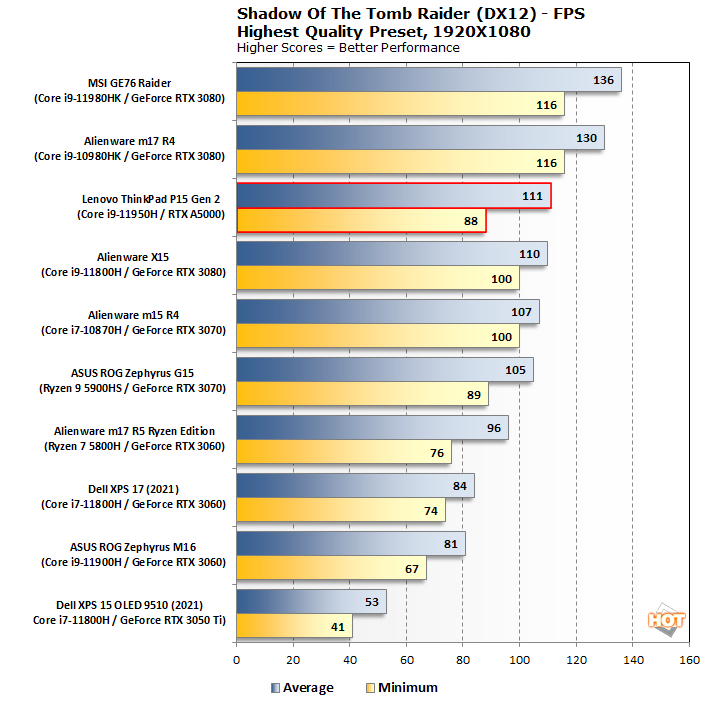
Shadow of the Tomb Raider DX12 Game Benchmarks
The finale in the rebooted Tomb Raider trilogy, Shadow of the Tomb Raider is easily the best-looking of the bunch. It's also brimming with Tobii eye-tracking hardware support, and leading edge graphics technologies. To test this game out, we again turned the visuals up to High and tested at the Full-HD resolution of 1920x1080.
Unfortunately, our observations from Gears 5 do not carry through to Shadow of the Tomb Raider. In this case, it barely edges out the Alienware X15's RTX 3080 in average framerates. Worse still, minimum framerates fall down in the range of RTX 3070 systems we have tested. This is why we test multiple game titles, and keep in mind your mileage will vary depending on the select titles you choose.
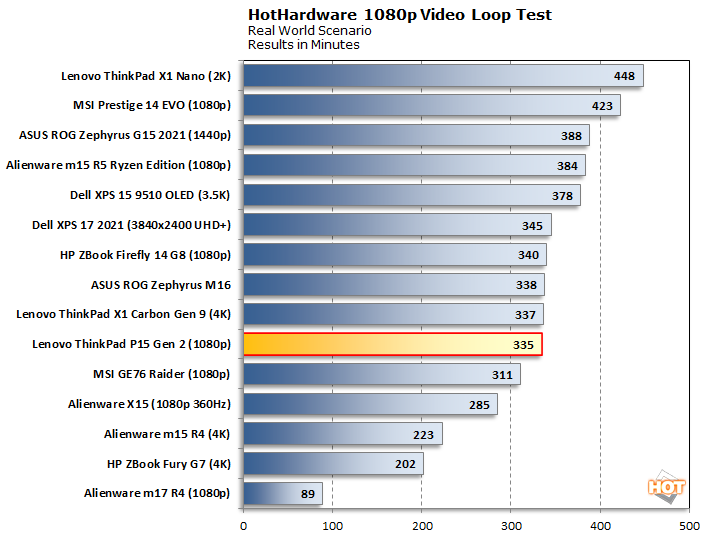
Video Loop Battery Life Testing
We run a custom 1080p HD video loop test developed in-house, to prove out battery life with our test group of machines. In all tests, Windows 10 Quiet Hours has been enabled and the displays are calibrated with lux meters on pure white screens to as close to 115 lux as possible. For the average laptop this is somewhere between a 40-60 percent brightness setting. In the case of the ThinkPad P15 Gen 2, this required dialing the screen to 50 percent.
The Lenovo ThinkPad P15 Gen 2 is equipped with a stout 94 watt-hour battery. This is very near the TSA's limit of 100 watt-hour capacity for lithium batteries in carry on bags for flights. As such, we had fairly high expectations given Lenovo's own guidance to select the FHD displays for maximum battery life.
In practice, the battery lasted for a little over 5 and a half hours in our video loop rundown test. This is near the bottom range of 1080p class displays in our line up, but we will not be so quick to judge it harshly either. The ThinkPad P15 Gen 2 still delivers the strongest battery life of the systems in its performance bracket. The only machines showcasing longer lasting batteries also have a lower performance envelope.
Lenovo also makes up for mediocre battery life somewhat with the system's charger. The 230W AC adapter can juice up the battery to around 80% in just an hour. Due to the physics of a battery's internal resistance, even a shorter charging period should be enough to eek out some extra hours of work. Granted, some cases demand longer trips away from the wall. If going the distance does become a priority, users can also dive into the BIOS to disable discrete graphics and push Window's power savings options even further.