It's time to dive into the performance tests. We ran a wide array of tess of and tried to stress each area of the system as much as we could. The result is a feast for all you data-starved workstation fiends out there. Let's dive in...
 |
|
ATTO Disk Benchmark |
|
Drive Performance |
|
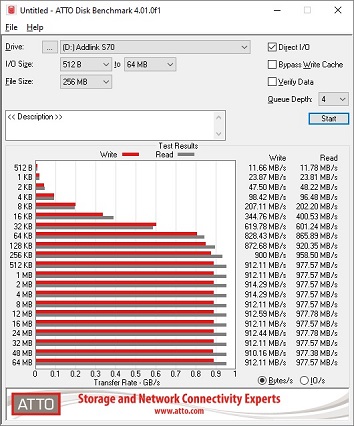
The
ATTO disk benchmark is a fairly quick and simple test which measures read/write bandwidth and IOPS across a range of different data sizes. While we don't typically compare these results across multiple machines, it's useful to gauge whether a particular system's storage subsystem can handle being put under pressure.
The internal SSD in our test system is a Western Digital SN730 NVMe SSD in the typical M.2 2280 format. This drive can crank through the data with read speeds of 3.2 GB/sec, which is basically limited only by its PCI Express 3.0 x4 interface. Write speeds are quite speedy as well, reaching 2.5 GB per second. IOPS max out at around 68k on reads and 65k on writes.
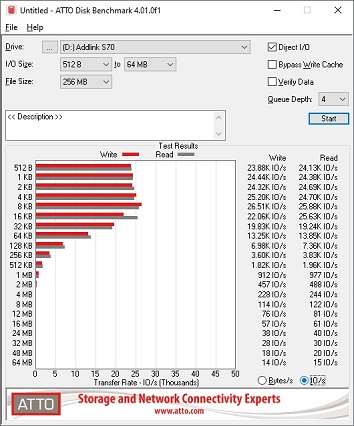
We also took an external drive for a spin. This is the
Addlink S70 NVMe SSD in an external USB 3.1 Gen 2 enclosure. We plugged this drive into one of the 10 Gbps USB 3.0 Type-C drives on the rear of the system and ran ATTO again.
The USB 3.1 Gen 2 port we tested with did a nice job of filling its allotted bandwidth with read and write operations. The 977.8 MB per seconds we registered works out to be 7.8 Gbps, which is a bit off of 10 but far north of the first-generation 5 Gbps introduced with USB 3.0. On the whole, we're pleased with this result.
 |
|
SiSoft SANDRA 2020 |
|
Subsystem Testing |
|
We continued our testing with the latest version of SiSoftware's SANDRA 2020, the
System
ANalyzer,
Diagnostic and
Reporting
Assistant. We stuck to the CPU, memory and cache subsystem tests here to get an early glimpse at performance. The Threadripper PRO 3995WX is a 64-core part, meaning it has eight fully-functional Zen 2 dies, each with all 8 cores enabled, making it effectively a bit EPYC processor. How quickly the various discrete caches respond is a small but important part of how the CPU works as a whole.
Starting with the CPU benchmarks, we can see that the ThinkStation P620's Threadripper PRO 3995WX and its 64 cores can far outstrip anything in the consumer CPU space. It turned in world-beating results in just about every area.
The cache and memory subsystem are nothing to sneeze at, although our system is constrained by only having two of its eight memory channels filled. That probably won't mean a lot to some workloads, but anything that is bandwidth sensitive in our suite will not show the system in the best light. However, those tasks can certainly be accelerated by adding more registered ECC DIMMs to the system's complement.
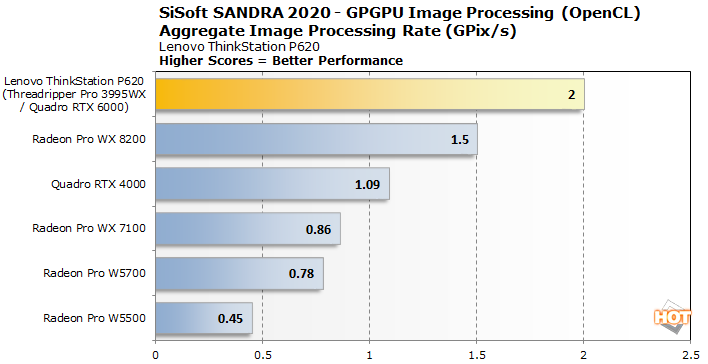
On the GPU side, we wanted to take a quick look at how all those graphics pipelines and 24 GB of VRAM translated into performance on non-graphics tasks.
In image processing, the ThinkStation's NVIDIA Quadro RTX 6000 graphics card takes the cake, beating out the Vega-based AMD Radeon Pro WX 8200 and the smaller Turing Quadro RTX 4000, each by a substantial margin. The P620 was around 33% faster than the Radeon and nearly twice as fast as the smaller Quadro.
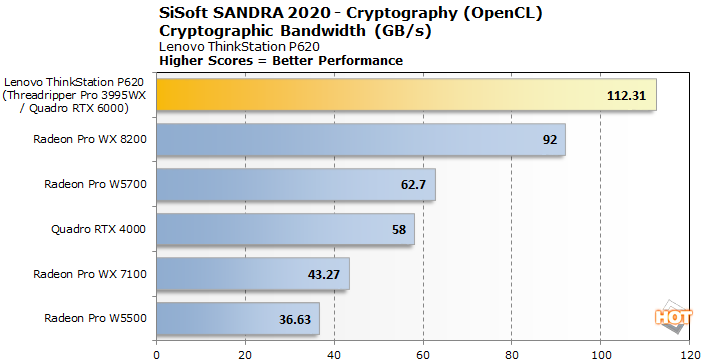
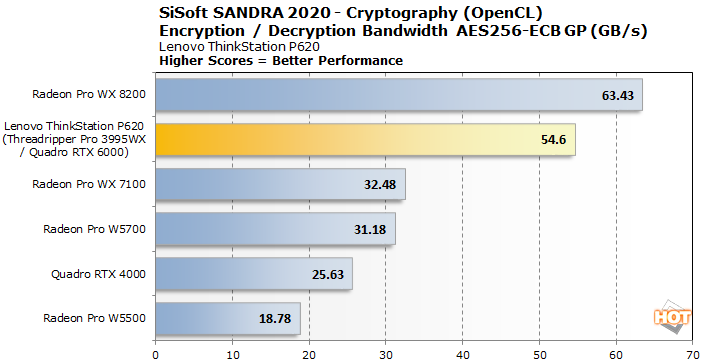
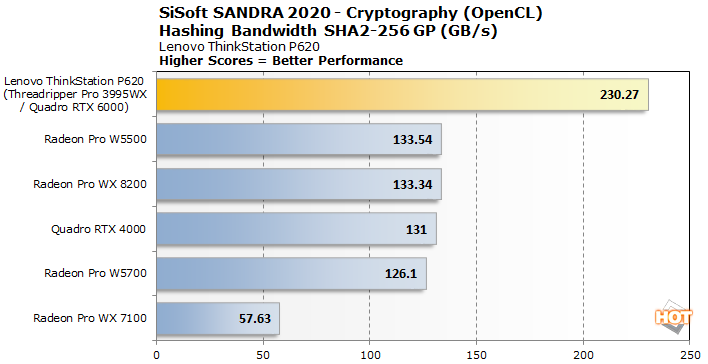
In the cryptography and hashing arenas, the Quadro RTX 6000 in the ThinkStation was extremely impressive in hashing bandwidth with the SHA2-256 algorithm, but not quite as fast as the Radeon Pro WX 8200 when it comes to AES256-ECB encrypting and decrypting.
|
|
Browserbench Speedometer 2.0 |
|
Web Application Performance |
|
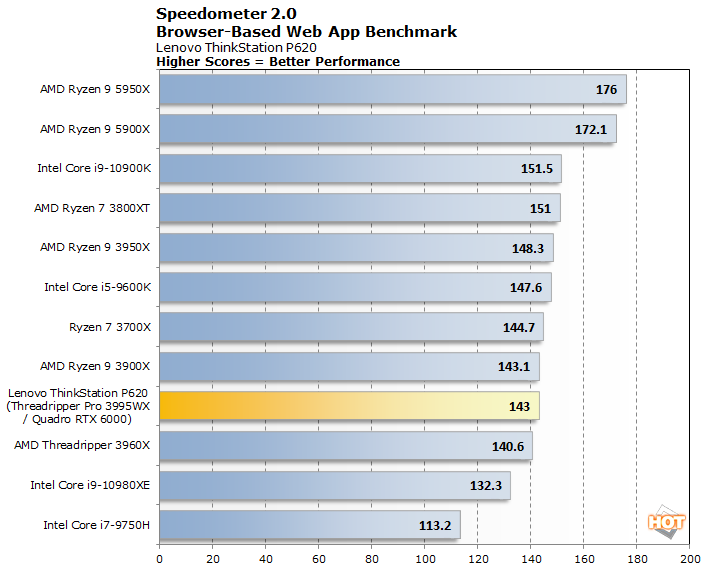
Next up, we have some numbers from the Speedometer 2.0 test available at browserbench.org. The Speedometer Benchmark Suite uses a wide array of latency and throughput benchmarks to evaluate web application performance, and all of the results are tabulated into a final score. The benchmark measures performance of an array of browser-based technologies used on modern, rich web applications. Scores in this benchmark are an indicator of the performance users would see when browsing and running advanced web apps.
All of the systems were tested using the latest version of Microsoft's Edge browser, with default browser settings, on a clean install of Windows 10 Professional x64.
This test might seem weird in a workstation review, but everyone is affected by web browser performance these days. Whether chatting on corporate apps like Slack (which runs on Electron in the desktop app) or keeping track of tickets in Azure DevOps, web rendering performance is important. That said, the ThinkStation P620 does just as well as any other Zen 2 system would in this benchmark. Once we get up over 100 or so runs per minute, it's running really fast, so browsing is unsurprisingly smooth.
|
|
PCMark 10 |
|
Office Productivity and System-level Benchmarking |
|
Next up we have some full-system testing with
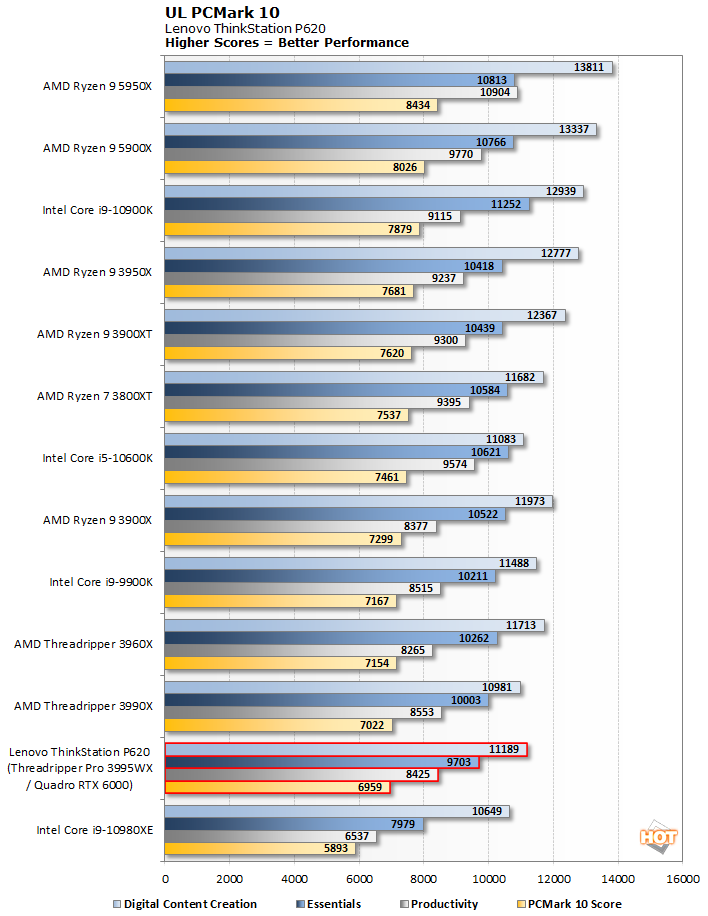
PCMark. We're reporting all test results from the PCMark 10 benchmark suite, including the Essentials, Productivity, Digital Content Creation and and total PCMark score. The Essentials test covers workloads like web browsing, video conferencing and app start-up times, while Productivity tests everyday office apps from spreadsheets to word processing. Finally, the Digital Content Creation test evaluates performance of a machine with respect to photo and video editing, as well as rendering and visualization.
Due to the lightly-threaded nature of the PCMark 10 test suite, the ThinkStation P620 actually sinks towards the bottom of our pack. It scored within a single percentage point of the Threadripper 3990X, which is good since the P620's
Threadripper PRO 3995WX is basically the same CPU with a slightly higher clock speed and more memory channels -- which, by the way, were left unpopulated with our 2 x 16 GB configuration. The Zen 3 CPUs reign supreme with their improved single-threaded performance.
|
|
X265 Benchmark |
|
Video Encoding Performance |
|
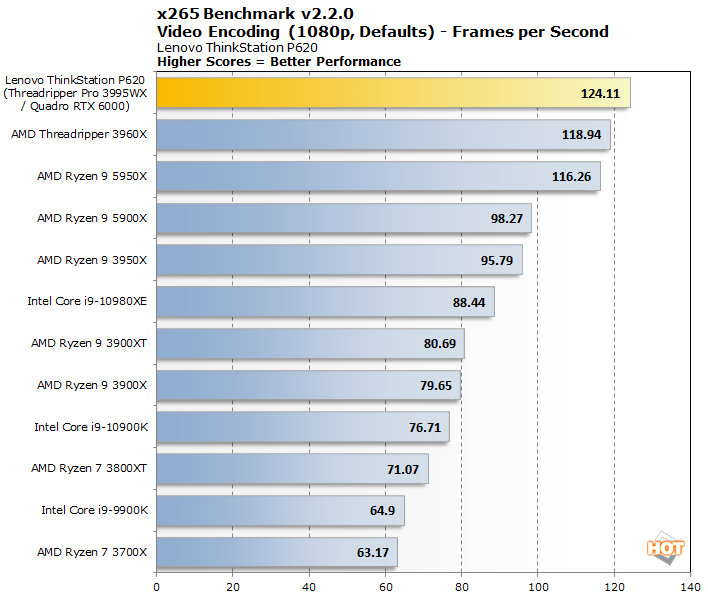
The multi-threaded HWBOT x265 Benchmark is based on the open source x265 encoder that leverages modern CPU instructions to speed video encoding. We tested the CPUs represented here with the 64-bit encoder using the default 1080p workload.
Here's a test where extra cores came in handy to a point. The ThinkStation P620 was twice as fast as the
Ryzen 7 3700X and even edged the 24-core Threadripper 3960X. However, much of that horsepower doesn't really see much use in this quick benchmark. Still, the ThinkStation P620 posted the best score we've ever recorded on this test.
|
|
Cinebench R20 |
|
Single Threaded and Multi Threaded Rendering Performance |
|
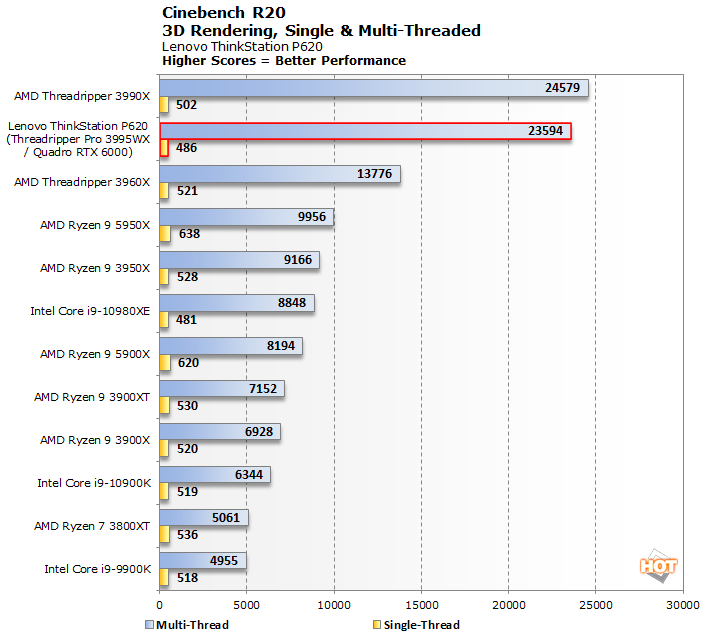
Cinebench rendering performance test based on Cinema 4D from Maxon. Cinema 4D is a 3D rendering and animation tool suite used by animation houses and producers like Sony Animation and many others. It's very demanding of system processor resources and can utilize any number of threads, which make is an excellent gauge of computational throughput. This is a multi-threaded, multi-processor aware benchmark that renders and animates 3D scenes and tracks the length of the entire process. The rate at which each test system was able to render the entire scene is represented in the graphs below. If ever there was a good application for this benchmark, it's in a workstation.
Unlike x265 or PCMark, Cinebench R20 can use all the hardware threads we could throw at it. The system's multi-threaded score was a full 48 times faster than its single-threaded mark, and that has a lot to do with its thermal budget. With just one core active, the Threadripper PRO 3995X in our Lenovo workstation was able to run at 4 GHz or more, whereas 64 cores no doubt caused the top speed to trend downward. The multi-threaded test completes in around five seconds, so it's kind of hard to tell how fast the cores were running. The P620 just dwarfed anything with fewer processor cores than it has at its disposal.
|
|
POV-Ray |
|
CPU Ray Tracing Performance |
|
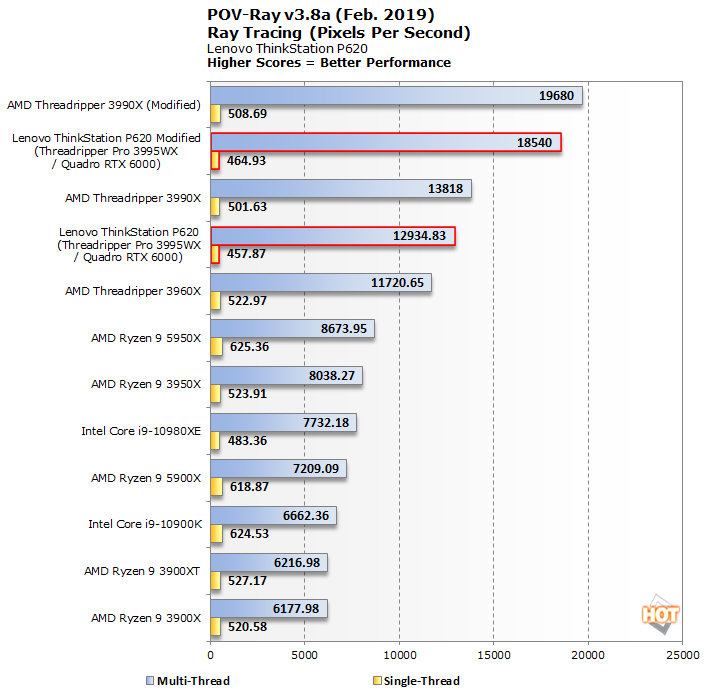
POV-Ray, or the Persistence of Vision Ray-Tracer, is an open source tool for creating realistically lit images. We tested with POV-Ray's standard 'one-CPU' and 'all-CPU' benchmarking tools on all of our test machines and recorded the scores reported for each. Results are measured in pixels-per-second throughput; higher scores equate to better performance.
Like the
Threadripper 3990X, we have two different results for the Threadripper PRO 3995WX. The publicly available version of the benchmark maxes out at 64 threads, but thanks to some patches contributed by AMD, we can test all 128 hardware threads on our ThinkStation P620. It's really a shame that not all the memory channels are populated here, because it's the only explanation we have as to why the Threadripper 3990X beat out the ThinkStation. The losses aren't enormous, but they're just over 5%, and every ray traced counts.
|
|
Blender 2.83 LTS |
|
3D Rendering Performance |
|
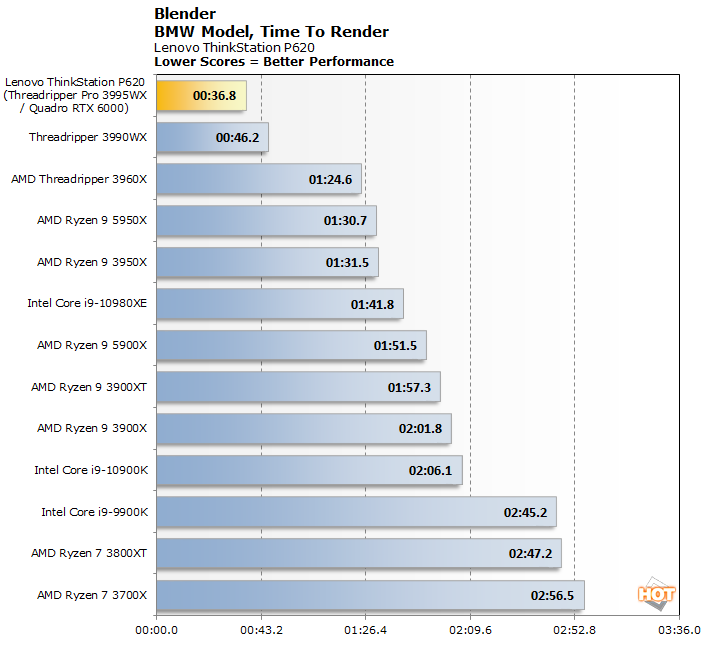
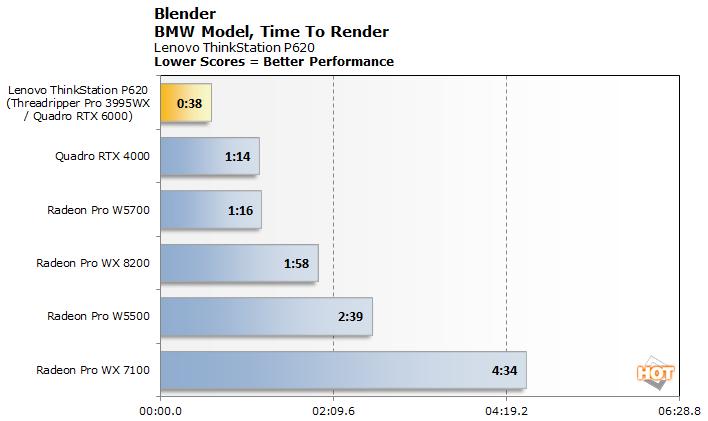
Blender is a free and open source 3D creation suite that can handle everything from modeling, rigging, animation, simulation, rendering, compositing and motion tracking, even video editing and game creation. It has a built-in benchmarking tool that will track the time it takes to complete rendering a particular model. We used a CPU-focused BMW model for these tests here. There are two sets of results: one using the CPU alone, and one relying on the Quadro RTX 6000 GPU against other workstation cards.
We'll start with the Blender CPU results. The Threadripper PRO 3995WX in the ThinkStation P620
ripped through this test in nothing flat. The 64-core processor was more than twice as fast as the 24-core
Threadripper 3960, where eight-core CPUs like the Core i9-9900K and Ryzen 7 3700X look downright pedestrian when they take four times as long to complete this benchmark. The ThinkStation P620 was made for a workload like this.
Here is where we'll slide from CPU benchmarks into GPU tests, by rendering the same scene with the Quadro RTX 6000.
The Quadro RTX 6000 graphics card was top of the heap thanks to its impressive load of CUDA cores and 24 GB of VRAM. The next-closest competitor, the Quadro RTX 4000, has the same 2,304 CUDA cores of the original GeForce RTX 2070, and it needed nearly twice as long to complete the scene. By the time we get to low-power professional cards like the Radeon Pro W5500, the ThinkStation P620 was done in one-fourth of the time.
|
|
LuxMark |
|
OpenCL Rendering Performance |
|
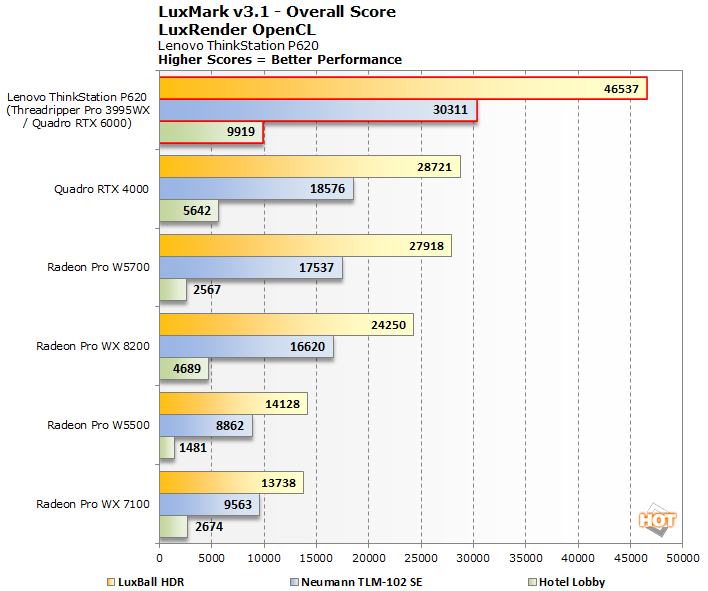
LuxMark is a cross-platform,
OpenCL-accelerated 3D rendering benchmark. It's a tool based on the open source LuxRender physically-based spectral rendering engine, which accurately models the transportation of light and supports high dynamic range. LuxRender features a number of material types to allow rendering of photo-realistic and artistic scenes. LuxRender is free software, licensed under the GPL, that offers plugins for packages like Blender, Maya, Cinema 4D and 3DS Max.
The ThinkStation P620 set some all-time marks on our charts, outpacing the Turing-based Quadro RTX 4000 by more than 50% each time. We should expect these kinds of results from a high-end professional workstation, but actually seeing that performance still impresses. The Hotel Lobby scene is the most complex of the three benchmark scenes, and also has the highest margin of victory for the
Quadro RTX 6000. The Lenovo workstation was nearly twice as fast as the second place RTX 4000, and more than 600% faster than the bottom-dwelling Radeon Pro W5500.
|
|
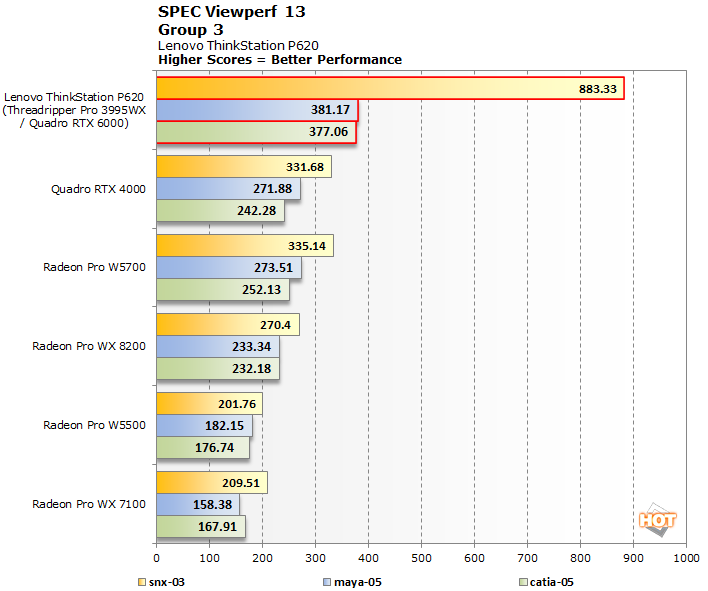
SPEC Viewperf 13 |
| 3D Modeling and Rendering Performance |
|
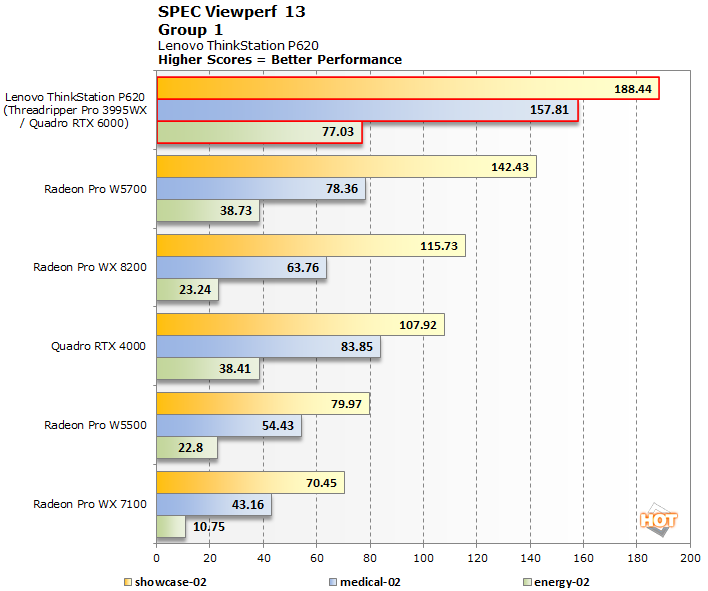
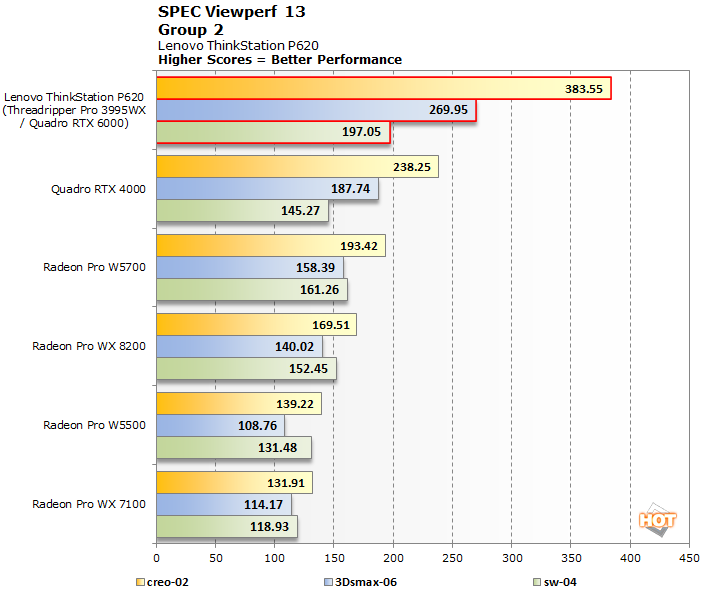
SPECviewperf includes a variety of tests, which produce significantly different framerates, so we've sorted them into three groups to make the results a bit easier to read. Please note the legends at the bottom of each chart, which designate the application or viewset used.
There isn't a lot to say here that the charts don't say for themselves. The ThinkStation P620, by virtue of its high-end Quadro RTX 6000, is the fastest system in each of the nine tests. The margin of victory is often 50 to 100 percentage points. In the snx-03 test, it's nearly three times as fast as the
Quadro RTX 4000.
|
|
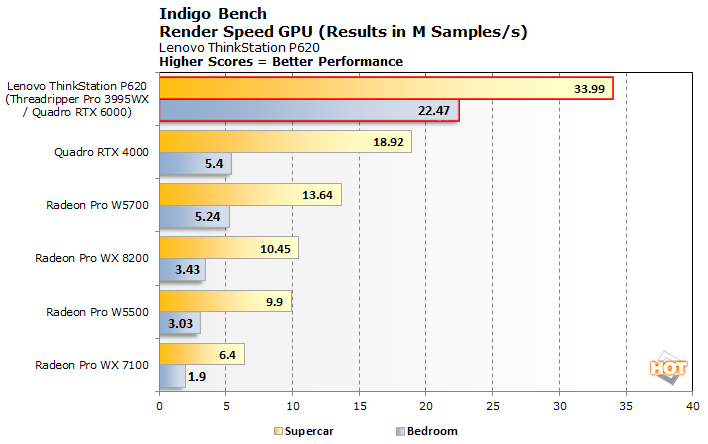
IndigoBench |
|
Rendering Performance |
|
IndigoBench is based on Indigo 4's advanced rendering engine and offers both CPU and GPU rendering modes for its two built-in models. The standalone benchmark is available for Windows, MacOS, and Linux and outputs results in M/Samples per second.
In Indigobench, the ThinkStation P620's Quadro graphics card was four times faster than the Quadro RTX 4000 in rendering the complex Bedroom scene, and nearly twice as fast in the simpler Supercar scene. The amount of compute power on display is nothing short of outstanding.
That's a lot to digest, but I think we can sum up the ThinkStation P620's performance as outstanding. Let's talk about thermal and acoustic performance next.