Maingear MG-1 Review: A Mighty, Beautiful Boutique Gaming PC
Maingear MG-1: Synthetic, Productivity, And Gaming Benchmarks

We ran the Maingear MG-1 through a fairly comprehensive suite of benchmarks even though we were confident we already knew how it would perform. If you're pressed for time, well, it runs like a machine with a Core i9-13900K and a Geforce RTX 4080. Hard-core enthusiasts may have already skipped this page, but we'd like you to read on, because we do have a few remarks to make about the performance of the MG-1.
First and foremost, we should explain the odd collection of results. The fact is, this is the most powerful pre-built gaming PC we've tested to date. The combination of the fastest CPU on the planet (for single-threaded workloads) with NVIDIA's second-fastest GPU of all time is preposterously puissant, and the latest-generation hardware for both CPUs and GPUs is a huge leap forward over the previous-generation. That means that our test data for gaming PCs released just last year is of limited utility.
As a result, you'll see a lot of results pulled from our recent CPU and GPU reviews here. Those results will be the ones marked with "HH Test Bench," as well as any data that doesn't describe the system it was captured from. Most of those results were recorded by the inimitable Marco Chiappetta on one of HH's test rigs, and as a result they may not be perfectly comparable to the results from a pre-built system like this, so just keep that in mind.
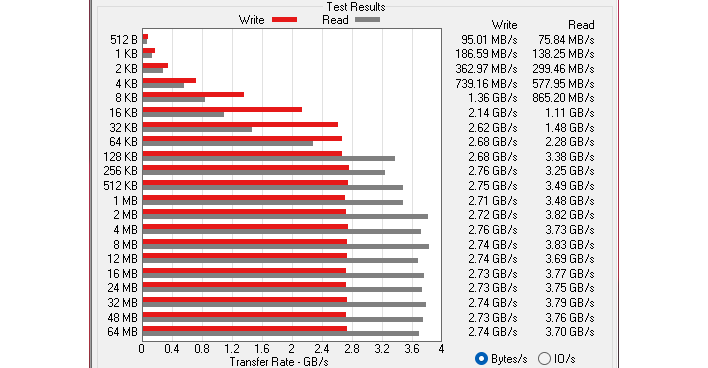
ATTO Disk Benchmark
The singular storage device in the Maingear MG-1 that we received is a one-terabyte Solidigm P41 Plus NVMe SSD. This is a mid-level drive that offers solid sequential read performance, but unfortunately lacks a DRAM cache. At this system's price point ($3500), we would really like to have seen a higher-level NVMe SSD like the ADATA XPG Gammix S70, but this certainly isn't a deal-breaker. It is probably the weakest point of the build in terms of specifications, though.
Speedometer 2.0 Web-App Benchmark
Speedometer is a test of web application performance. All those apps that run in a browser tab, like Slack, Discord, Google Docs, and even YouTube are reasonably represented by this test; Speedometer gives you a decent gauge of how those apps will run on a given system in a given browser. Indeed, results vary tremendously between browsers, and even between different browser versions. All of our tests here were done on the latest version of Microsoft Edge.
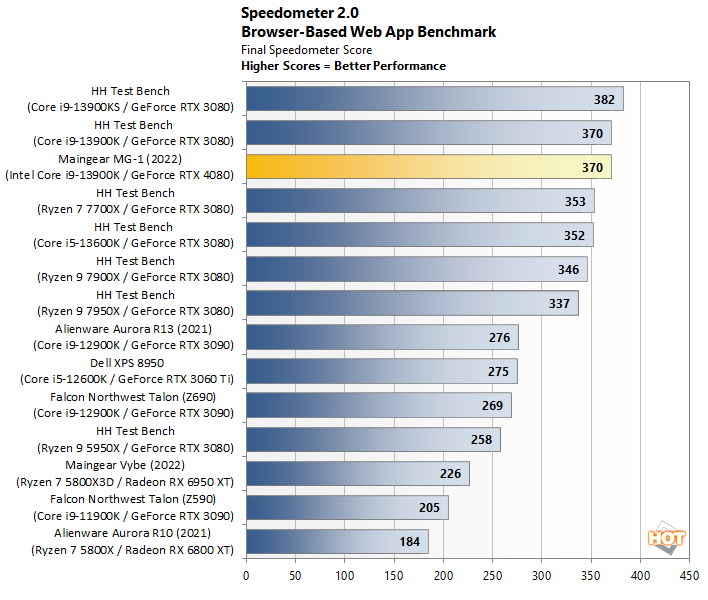
Starting our system benchmarks off with the relatively-overlooked Speedometer benchmark. While all of our benchmarks are selected for purpose, Speedometer is arguably the most important non-gaming test of the set. People do everything in a browser these days; I'm even writing this text in a browser.
For a full system review, a test like this isn't particularly necessary, but it's good to confirm that everything is running as expected. Indeed, the Core i9-13900K in the MG-1 scores exactly the same result as the same processor in our test bench, which is a very good thing indeed.
Cinebench R23 Rendering Benchmark
Contrary to what some would have you think, Cinebench isn't a purely synthetic benchmark. It's based on a real application: Maxon's Cinema 4D modeling software, and it measures rendering performance under that workload both on a single thread as well as across all of the CPU's threads.
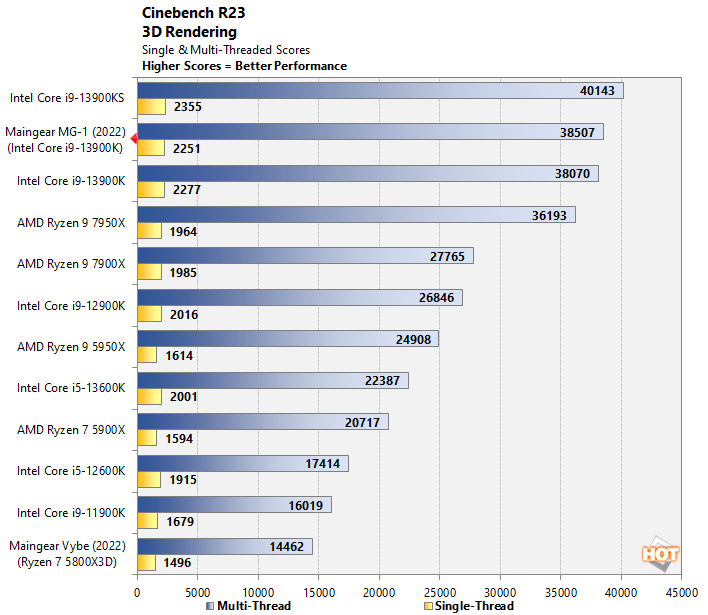
Once again, the MG-1 runs neck-and-neck with our test bench. It comes out slightly behind in single-threaded speed, but slightly ahead in multi-threaded performance, which we are happy to chalk up to run-to-run variance in this non-deterministic benchmark.
Blender 3D Rendering Benchmark
Blender is a free and open source 3D creation suite that can handle everything from modeling, rigging, and animation to simulation, rendering, compositing and motion tracking. It has a purpose-built benchmarking tool that includes three pre-built scenes to render out while tracking the time it takes to completely render each scene.

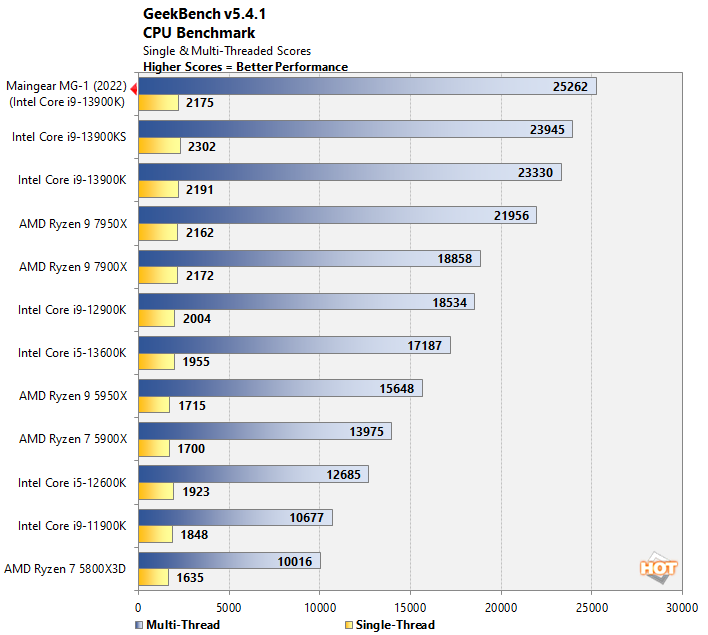
Geekbench v5.4.1 System Benchmark
Geekbench is a cross-platform benchmark that simulates real world processing workloads in image processing and particle physics scenarios. It measures single-threaded performance (allowing a single core to stretch its legs) as well as multi-threaded throughput, putting all cores under a heavy load.
3DMark Time Spy DirectX 12 Benchmark
As usual, we'll start off our 3D benchmarking with 3DMark. If you're somehow unfamiliar, 3DMark is a synthetic game-like benchmark for assessing gaming graphics (GPU) and physics (CPU) performance. This tool has a wide variety of tests and demos that target various types of graphics workloads, to give a better picture of how a system will handle real games. We used the Time Spy benchmark, 3DMark's DirectX 12 test. This test has multiple presets, but the standard Time Spy test is plenty taxing.
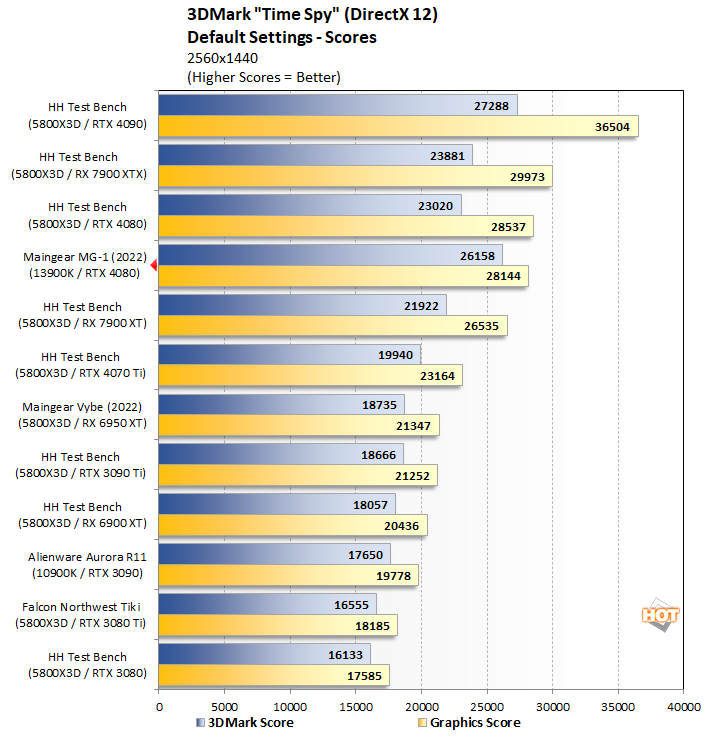
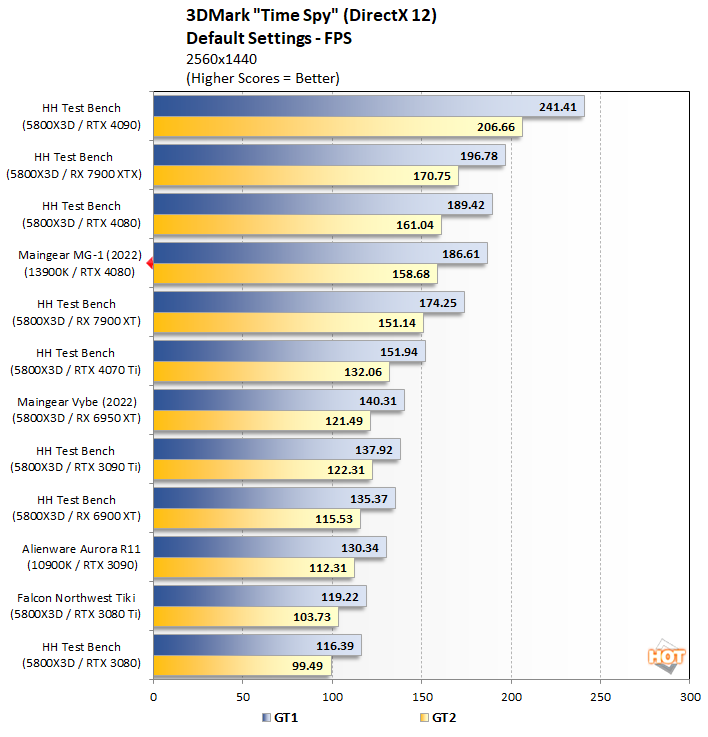
To be fair to the Ryzen processor in our test bench, 3DMark's CPU score is based on a multi-threaded physics simulation that is arguably unrealistic compared to actual games. This allows our 24-core Intel CPU to really blow away the 8-core 5800X3D. That's not necessarily the case in real games, though, and the framerates in the game tests here represent that.
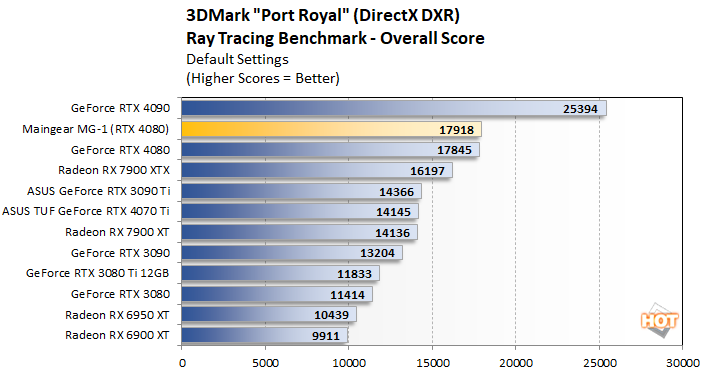
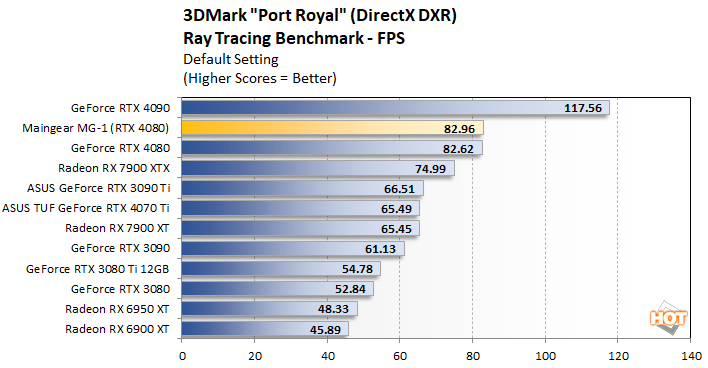
3DMark Port Royal DirectX Raytracing Benchmark
Port Royal was released as an update to UL’s popular 3DMark suite. It is designed to test real-time ray tracing performance of graphics cards that support Microsoft DirectX Raytracing, or DXR. Although DXR is technically compatible with all DX12-class GPUs, the graphics card must have drivers that enable support for the feature.
Unigine Superposition VR Benchmark
Superposition is the latest benchmark from Unigine, powered by the UNIGINE 2 Engine. It offers an array of benchmark modes, targeting gaming workloads as well as VR, with both DirectX and OpenGL code paths. There's an extreme hardware stability test built-in too. Unigine Superposition uses the developer’s unique SSRTGI (Screen-Space Ray-Traced Global Illumination) dynamic lighting technology along with high quality textures and models, to produce some excellent visuals. We ran Superposition's VR Future benchmark to compare the MG-1 against several systems as well as our test bench.
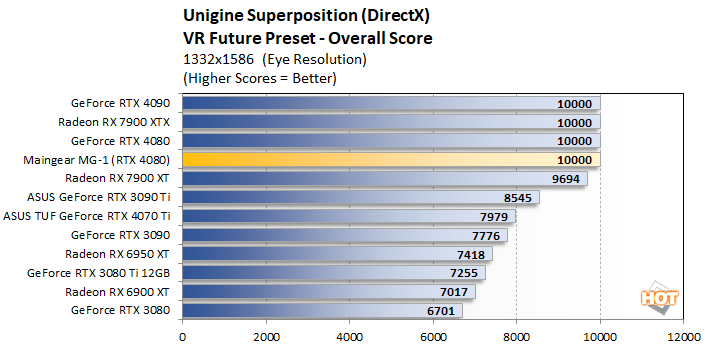
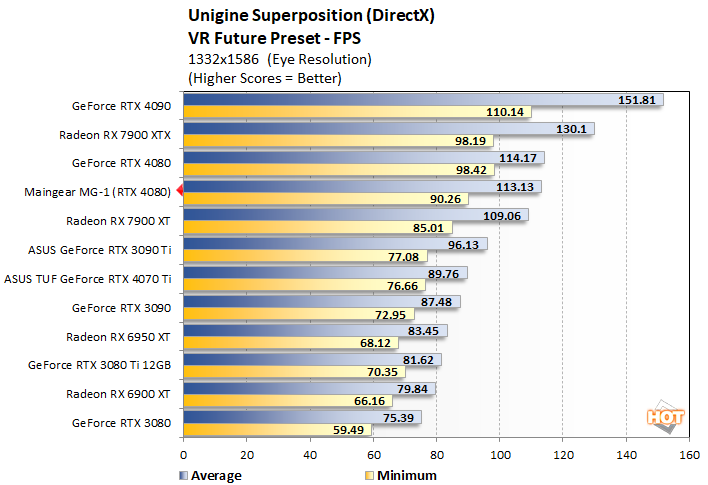
Ah, much better. It seems like Superposition prefers the large cache of the Ryzen 7 5800X3D in our test bench rather than the Core i9-13900K's superior single-threaded performance, but a 90 FPS minimum is very far from something to complain about.
Final Fantasy XIV Endwalker Benchmark
Final Fantasy XIV: Endwalker launched at the end of 2021, and as usual, Square-Enix updated its free character creator and benchmark tool. The free utility checks in at approximately a 2.21GB download. It will test your PC's ability to run the game at various settings, and presents a final result with an overall rating upon its conclusion. We tested Final Fantasy XIV: Endwalker at 1440p and in 4K UHD, with maximum image quality settings.
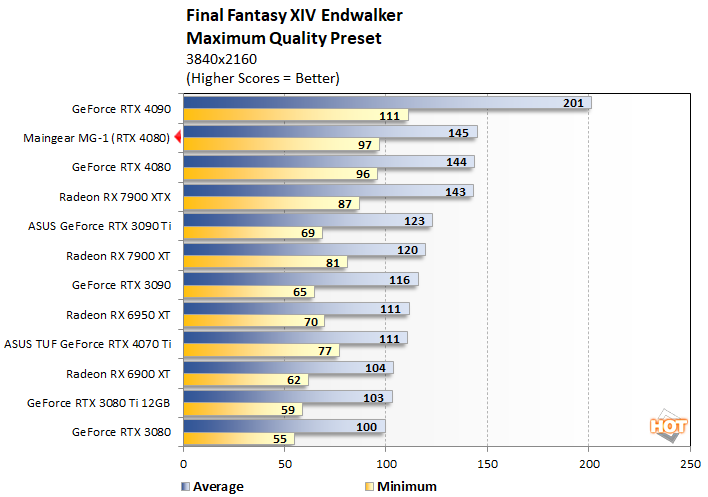
Like with many of the other tests, we see fundamentally identical performance to our test bench. Final Fantasy XIV certainly prefers our MG-1's Core i9 processor to the AMD CPU in the test bench, but the difference is fairly academic when we're getting over 140 FPS average, even in 4K.
Forza Horizon 5 Benchmark
Forza Horizon 5 is currently the latest edition of Microsoft and Playground Games' popular open-world racing franchise. This title leverages the proprietary ForzaTech engine and DirectX 12 Ultimate to deliver much larger maps than its predecessors, with more detailed models and higher graphics fidelity in general including some ray-traced reflection effects. We tested the game in 4K with the "Extreme" graphics preset.

Forza Horizon, on the other hand, definitely prefers the extra clocks of our Core i9-13900K CPU. This is an outstanding performance is what is honestly a pretty demanding benchmark. There's no need for the game's supported DLSS upscaling here; with a minimum framerate of 113 FPS you'd be sacrificing a bit of image quality to gain very little at all.
Marvel's Guardians of the Galaxy Benchmark
Marvel’s Guardians of the Galaxy is an action-adventure game where you play as Star-Lord and lead the rest of the Guardians from mission to mission. The game’s minimum requirements call for a Radeon RX 570 or GeForce GTX 1060-class GPU, but it also supports some of the latest graphics technologies, including DXR and DLSS.
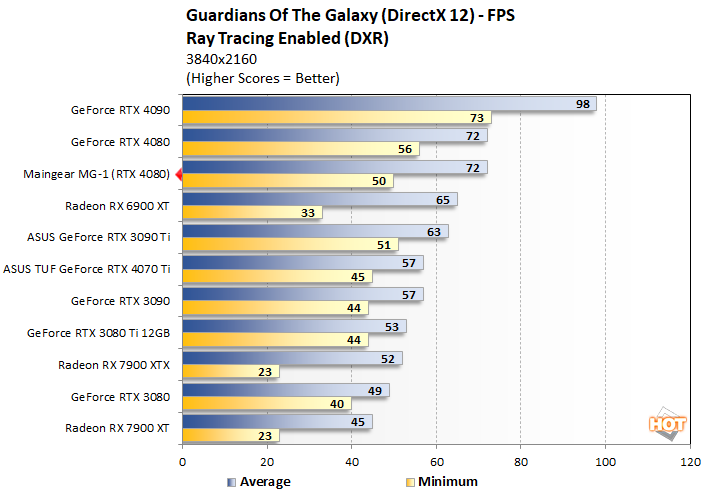
This is another outstanding performance for the Maingear MG-1. Don't make too much of the difference in minimum framerate here; like many games, the canned benchmark in Guardians of the Galaxy is not completely deterministic, which means there can be considerable variation in the results.
F1 22 Formula 1 Racing Benchmark
F1 2022 is Codemasters' latest Formula One racing simulation, and like previous version of the game, it sports impressive visuals. This latest addition to the franchise supports DirectX 12 with ray tracing, and it incorporates support for a number of AMD and NVIDIA technologies (like FSR 2.2 and DLSS Frame Generation). We tested the game with its Ultra High graphics preset, with ray-tracing and TAA enabled.
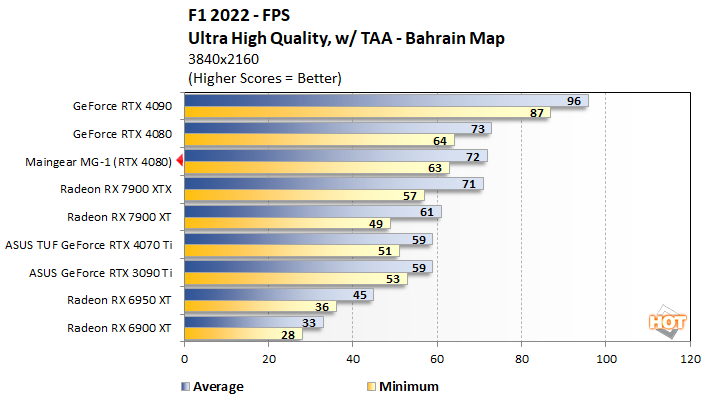
F1 22 just got an update to add the latest version of AMD's FidelityFX Super Resolution, and we played quite a bit of it for our investigation of that technology. We came away pleased with AMD's progress, but to tell the truth, the game does seem to heavily prefer GeForce cards. Our RTX 4080s sail past even the power-thirsty Radeon RX 7900 XTX in this test.
A Plague Tale: Requiem DLSS 3 Benchmark
A direct sequel to 2019's indie hit A Plague Tale: Innocence, Requiem follows the tale of young Amicia de Rune as she ventures across the medieval world she inhabits with her sickly younger brother to find a cure for his condition. Despite being produced by a relatively small team, Requiem uses a proprietary game engine with support for all the latest graphical features, including DLSS 3 Frame Generation.
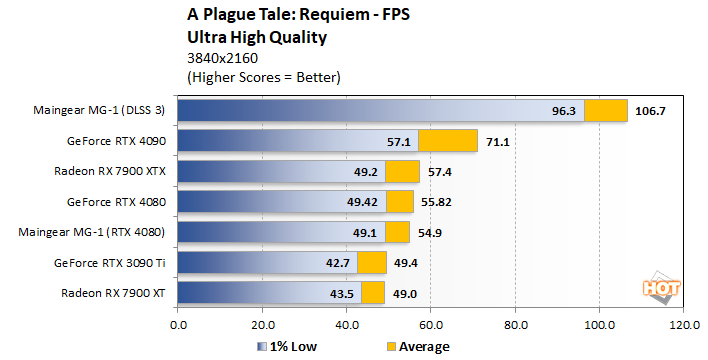
We were able to see the difference, though—50 FPS and 100 FPS look quite different on a 120 Hz display. While we need to do more in-depth testing to make any definitive statement about the merits of DLSS 3, this result is quite promising. We're looking into doing a thorough examination of DLSS 3 soon.

With all those benchmarks out of the way, let's go talk about the MG-1's power consumption and thermal performance before we give our thoughts and shuttle it off back to Maingear.


