We tested the
Maingear Turbo as it shipped from the company to ensure we got the same out-of-box experience as your average buyer, with the latest Windows and driver updates installed. Many variables can affect performance, so our comparisons should serve as a reference point, but may not be exactly like yours, even with similar configurations. Our benchmarking kicks off with some SSD, system-level and CPU benchmark tests to get an idea how the Turbo performs with a variety of workloads...
 |
ATTO Disk Benchmark
|
Peak Sequential Storage Throughput
|
|
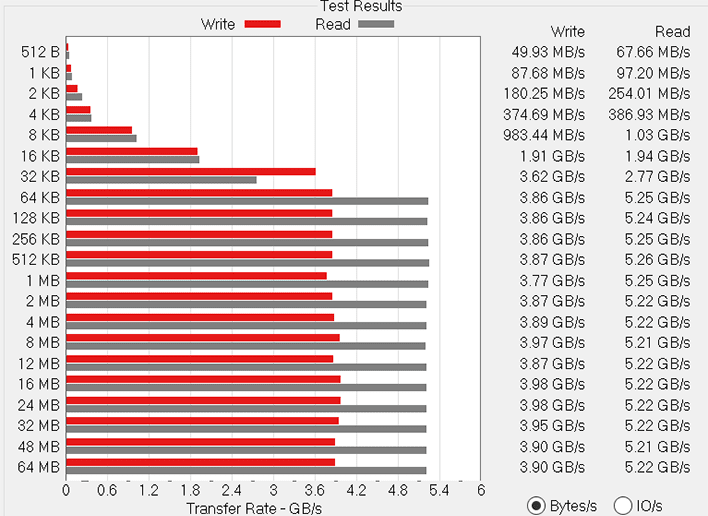
Running
ATTO Disk Benchmark allows us to gauge the speed of the storage drive in the Maingear Turbo. The primary storage on this configuration is a 1TB Seagate Firecuda 520 PCIe Gen 4 SSD (secondary storage is a WD Black 4TB HDD). Unlike SATA-based SSDs, NVMe drives shuttle data through the PCIe bus for potentially must faster read and write performance. This particular drive is rated to deliver up to 5GB/s of sequential reads and 4.4GB/s writes.
The
Seagate Firecuda 520 drive in the Maingear Turbo (which was the boot / OS volume) actually exceeded its 5GB/s read spec, and broke the 5.2GB/s mark with the large transfer sizes. Writes didn't quite hit 4.4GB/s, but they did flirt with the 4GB/s mark.
 |
Cinebench R20
|
3D Rendering Performance
|
|
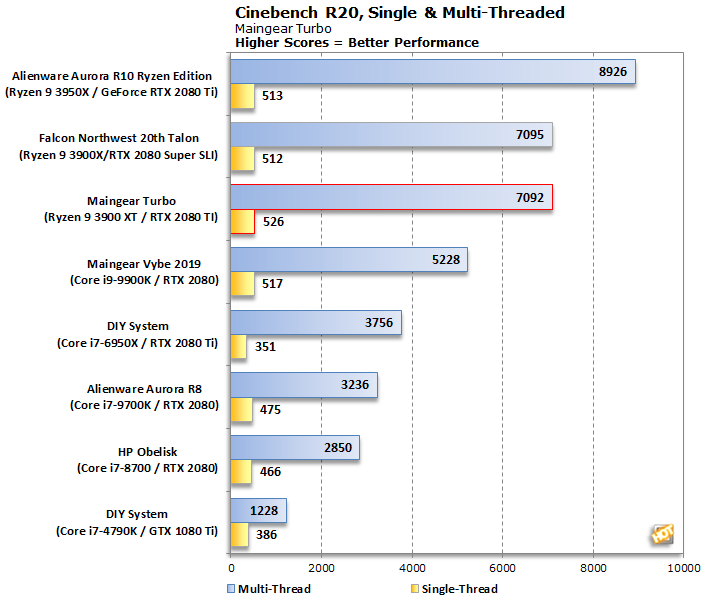
So, how does the tiny Maingear Turbo with its Ryzen 9 3900XT perform in our suite of tests? We'll start out with Cinebench R20, which we ran in both single-threaded and multi-threaded modes. The test is based on
Maxon’s Cinema 4D modeling software that’s used in movie production studios.
The Maingear Turbo landed right alongside the Falcon Northwest 20th Anniversary Talon we recently evaluated. The Turbo's single-threaded score was a couple of points better, but the larger Talon pulled ahead in the multi-threaded test.
|
|
BrowserBench Speedometer 2.0 |
|
Web Application Performance |
|
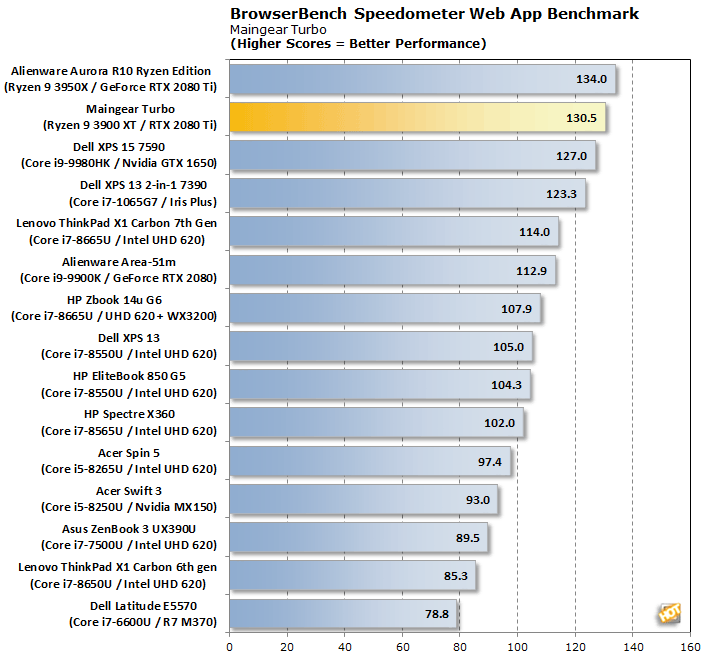
We recently incorporated BrowserBench.org's Speedometer test, which takes a holistic look at web application performance. This test automatically loads and runs several sample webapps from ToDoMVC.com using the most popular web development frameworks around, including React, Angular, Ember.js, and even vanilla JavaScript. This test is a better example of how systems cope with real web applications, as opposed to a pure JavaScript compute test like JetStream. All tests were performed using the latest version of Chrome.
The Maingear Turbo rocketed into second place here, trailing only the Ryzen 9 3950X-powered Alienware Aurora R10.
|
|
PCMark 10 |
|
Full System Productivity Performance |
|
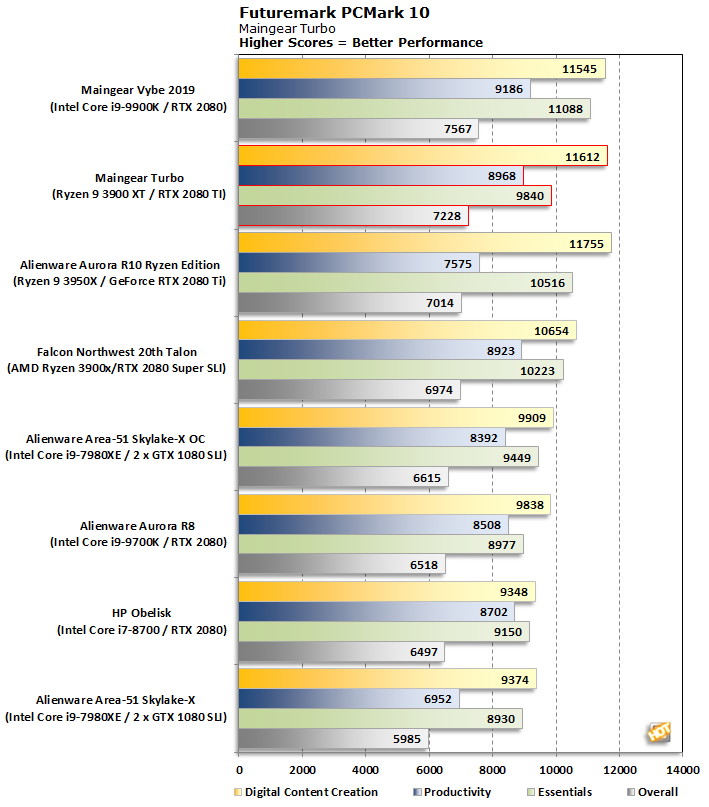
PCMark and
3DMark are something of a standard when it comes to testing full-system performance in machines with discrete GPUs and very fast CPUs. Both apps report plenty of data in both detail and summary form, and we ran all of the tests that work the Alienware Aurora R10 Ryzen Edition's hardware pretty hard.
UL Benchmarks' suite of tests have been the go-to system benchmarks since the late ‘90s. We ran the Aurora through
PCMark 10, which is designed to gauge the system performance in everyday use case scenarios with GPU acceleration-enabled, while 3DMark tests its gaming chops.
The diminutive Maingear Turbo also put up some strong numbers in PCMark10. Here, the Turbo trails only the larger,
Intel-powered Maingear Vybe. The Turbo offered the better Content Creation score than the Vybe, as you'd expect given the Ryzen's core count advantage, but the Vybe pulled ahead in the remaining tests, which boosted its overall score into the pole position.