To test the MSI Prestige 14 EVO, we updated the system with all of the latest updated available via Windows Update and MSI's utility. In this case, that means updating the existing Windows 10 Home 2004 installation, as the 20H2 did not automatically get installed. All drivers and preinstalled apps were updated to the latest available from MSI, too. Then we ran each benchmark at least three times, taking the median of our scores. Since the Tiger Lake-based system is running at the upper limits of Intel's TDPs, we also bumped the fan profile to the maximum and pushed the Windows performance slider to Best Performance and re-ran a selection of benchmarks that way, as well.
 |
| ATTO Disk Benchmark |
| Peak Sequential Storage Throughput |
|
The
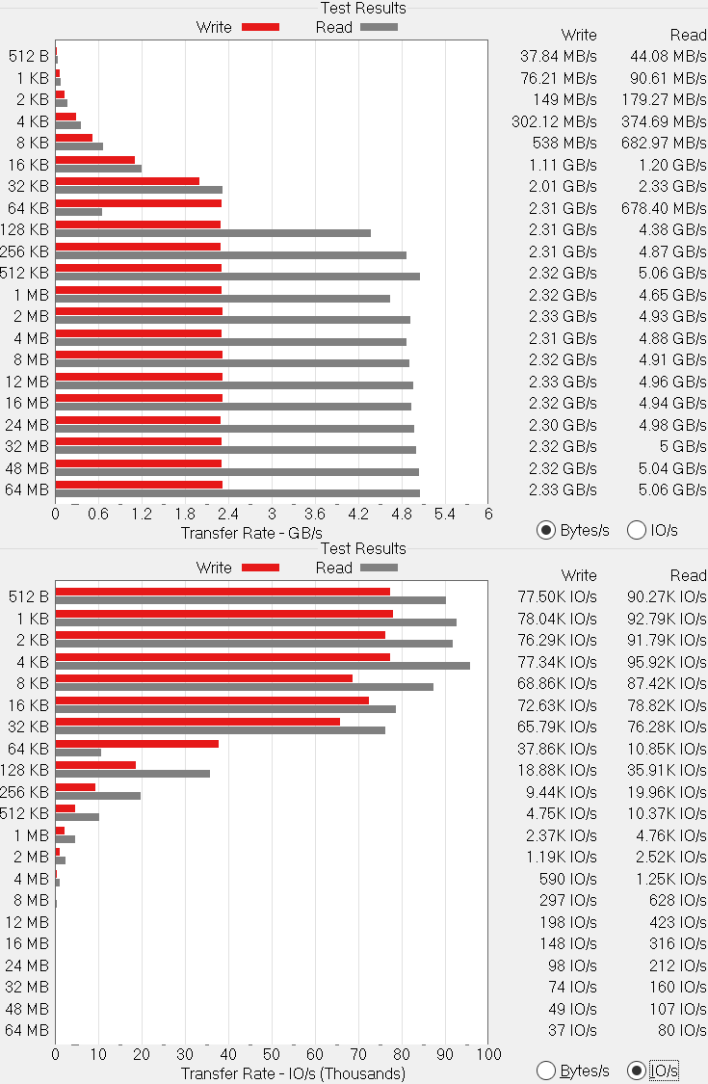
ATTO disk benchmark is a fairly quick and simple test which measures read/write bandwidth and IOPS across a range of different data sizes. We get a pair of results at each data point: bandwidth measured on MB per second (or GB per second if the result is that high), and input/output operations per second (IOPS).
The SSD in the Prestige 14 EVO is a Phison-branded drive, model SM280512GKBB4S-E162. That's quite a mouthful, but it's using a Phison PCIe 4.0 NVMe controller, and it shows. Raw bandwidth pushes upwards of 5 GB per second on reads and 2.3 GB/sec for writes. Transactional performance is very solid, too, as it hits nearly 100k reads at the 4kB transaction size, and on 80k writes.
|
| Speedometer Web Application Benchmark |
| Browser Performance |
|
BrowserBench.org's
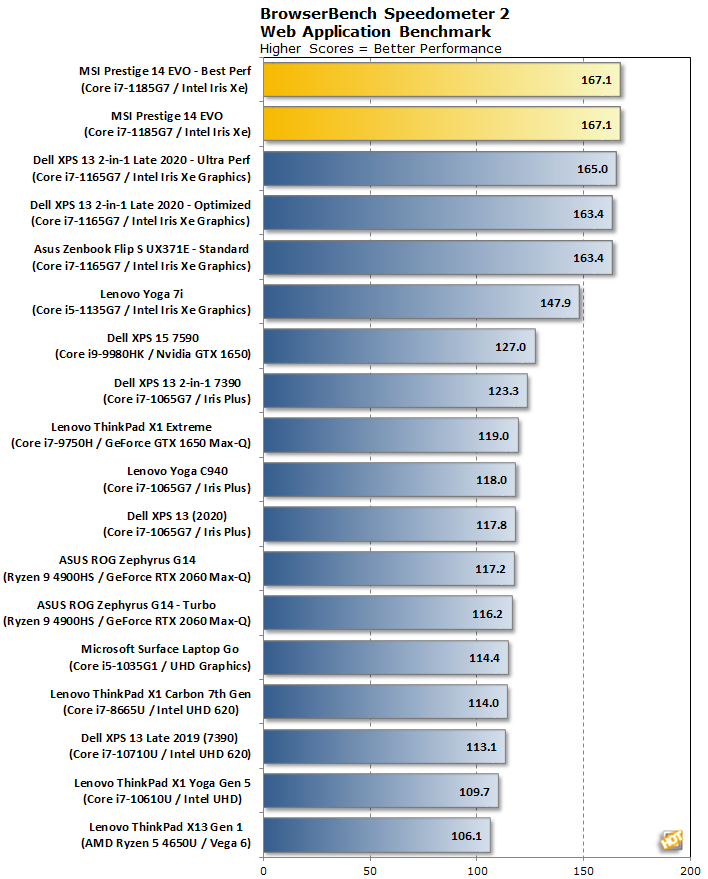
Speedometer is a real-world application of web application performance in the browser. This test automatically loads and runs several sample webapps from ToDoMVC.com using the most popular web development frameworks around, including React, Angular, Ember.js, and even vanilla JavaScript. This test is a better example of how systems cope with real web applications, as opposed to a pure JavaScript compute test like JetStream. All tests were performed using the latest version of Chrome.
Things start off strong for the MSI Prestige 14 EVO, as it takes the top spot in this web-based test. That margin of victory is pretty modest, however, as the ASUS and Dell
Tiger Lake machines are right on its tail. We already knew that Tiger Lake represented an incredible boost over even Ice Lake when it comes to single-threaded performance, so this test mostly shows that all is right with the world.
|
|
Cinebench R20 & R23 |
| 3D Rendering Performance |
|
The previous version of Maxon's rendering benchmark,
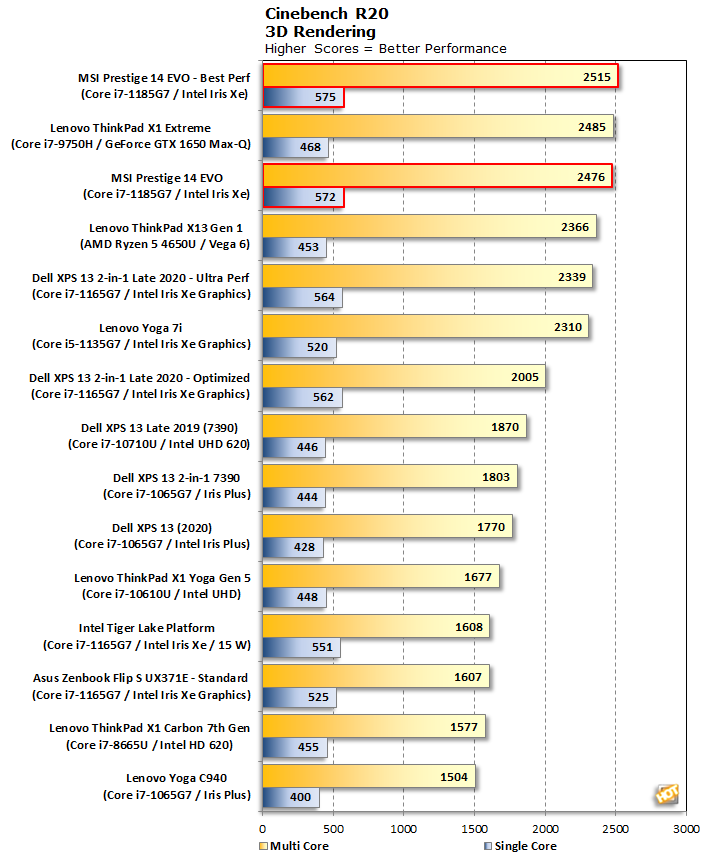
Cinebench R20, uses a long, sustained load, which makes it a good indicator of how well the cooling system in a notebook performs. This version is a pure CPU benchmark, and we tested both single-threaded and multi-threaded performance here.
Once again, MSI takes the top spots in our test. And again, its single-threaded advantage over its 15 W peers is minimal. The same can be said for multi-threaded performance here, although there definitely is around a 4-5% advantage. Unfortunately, the Best Performance slider in Windows combined with the aggressive fan profile doesn't really gain much, either. We'll dig into this as we discuss thermal performance on the next page.
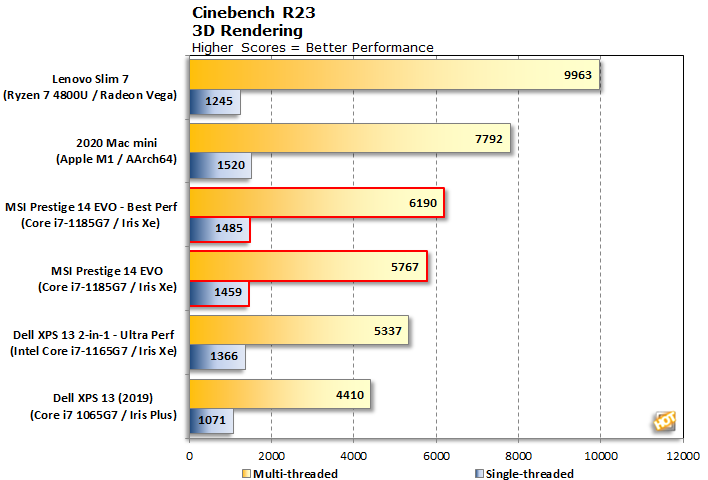
Recently, Cinebench R23 burst onto the rendering scene (heh), boasting new features like a sustained test and support for Apple's M1 SoC found in the recent
2020 Mac mini, MacBook Air, and MacBook Pro. The score scaling has changed, too, so these scores are not at all comparable to the last iteration.
Finally, it seems the Mac mini (and by extension, the Mac notebooks) might have finally met their single-threaded match. Almost. The Prestige 14 EVO scores within a couple percentage points of the Apple machines. More importantly for Windows users, it put up the very best single-threaded performance among our entrants. However, the Ryzen 7 4800U in the Lenovo Slim 7 came along and swept the multi-threaded benchmark by a significant margin thanks to its eight cores.
|
| Geekbench 5 |
|
Single and Multi-Core Performance |
|
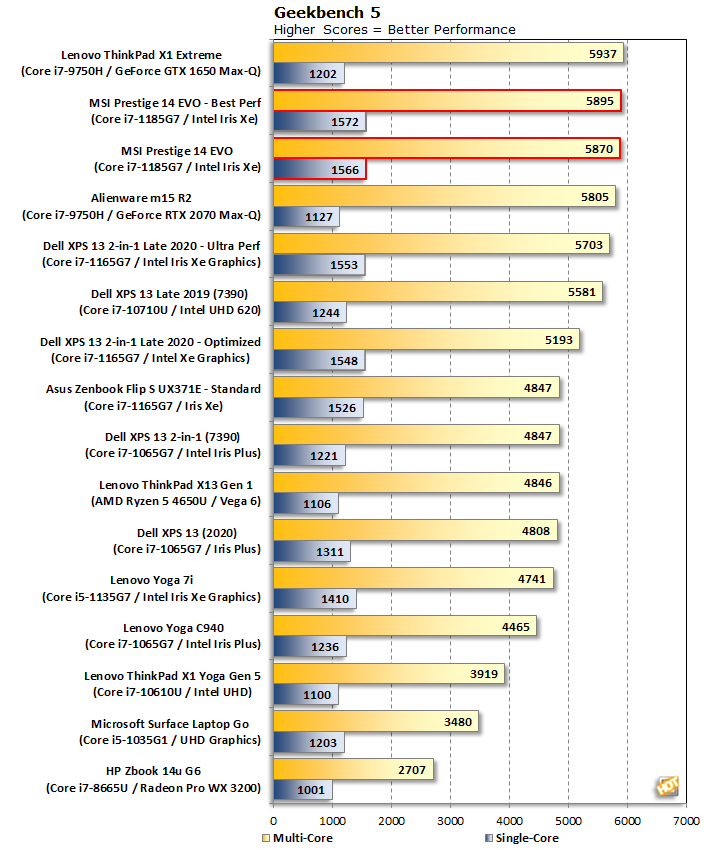
Geekbench is a cross-platform benchmark that simulates real world processing workloads in image processing and particle physics scenarios, among many others. We tested the notebooks featured here in Geekbench's single and multi-core workloads.
Geekbench tells much the same story as Cinebench. There's a measurable difference between the 28 W TDP of the Prestige 14 EVO and the 15 W CPUs in the
Dell XPS 13 9310 2-in-1, but at 6% on the multi-threaded test, it's pretty modest. That's still enough to bump MSI's notebook up over the hexacore 9th generation CPU with a much higher 45 W TDP in the Alienware m15 R2, which is pretty outstanding.
|
| PCMark 10 |
|
Productivity and System-level Benchmarking |
|
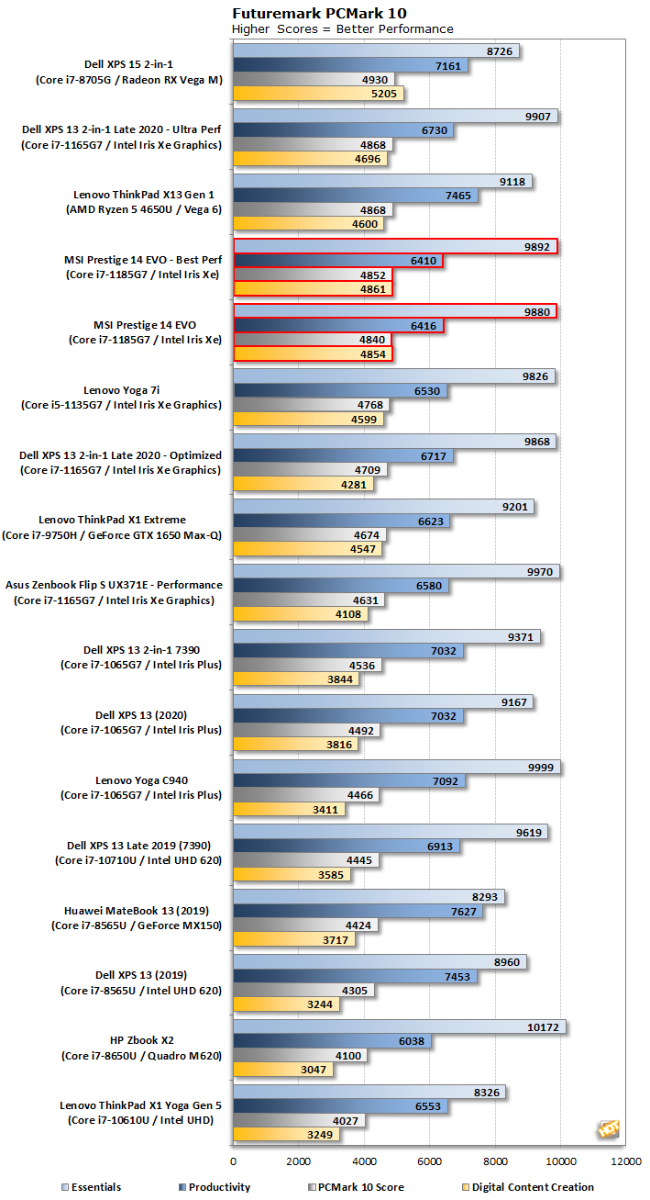
PCMark 10 uses a mix of real-world applications and simulated workloads to establish how well a given system performs productivity tasks, including image and video editing, web browsing, and OpenOffice document editing. While these scores appear to be all over the place, the systems are sorted by their overall PCMark score, which is the third (gray) bar in each cluster.
In PCMark, the MSI notebook essentially ties for the highest overall score with both the other Tiger Lake entrants, as well as systems with discrete graphics cards. The integrated Iris Xe graphics and the higher TDP actually power this system to the second-highest Digital Content Creation score of all systems with integrated graphics, and second overall. The 28 W TDP hasn't managed to separate itself from the pack, however.
|
| 3DMark Benchmarks |
| 3D Performance |
|
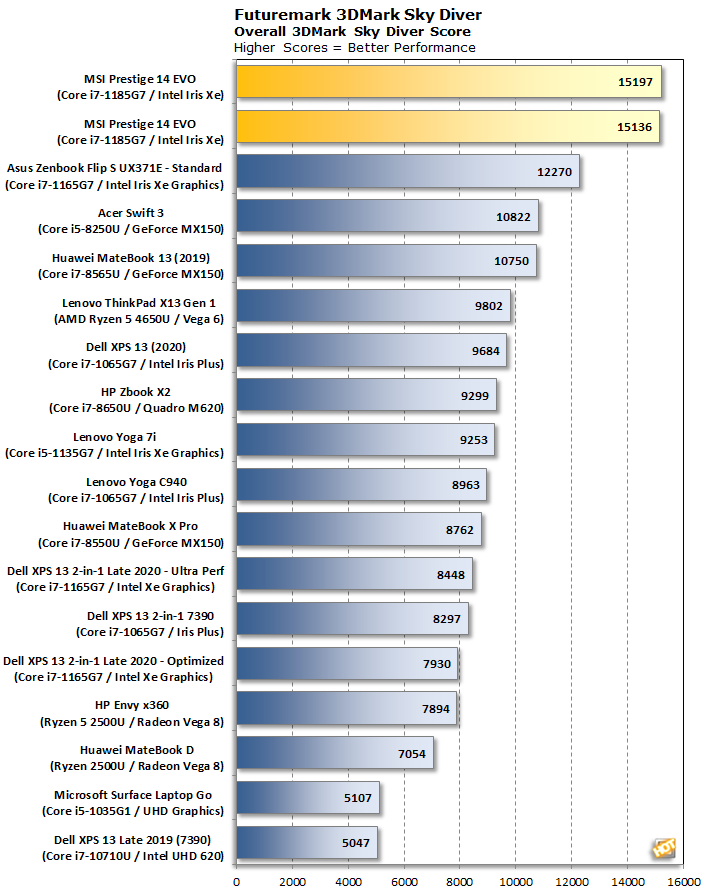
3DMark has several different graphics tests which focus on different types of systems. UL seems to have discontinued support for Cloud Gate, but fortunately there are a couple of tests remaining that run well on integrated graphics.
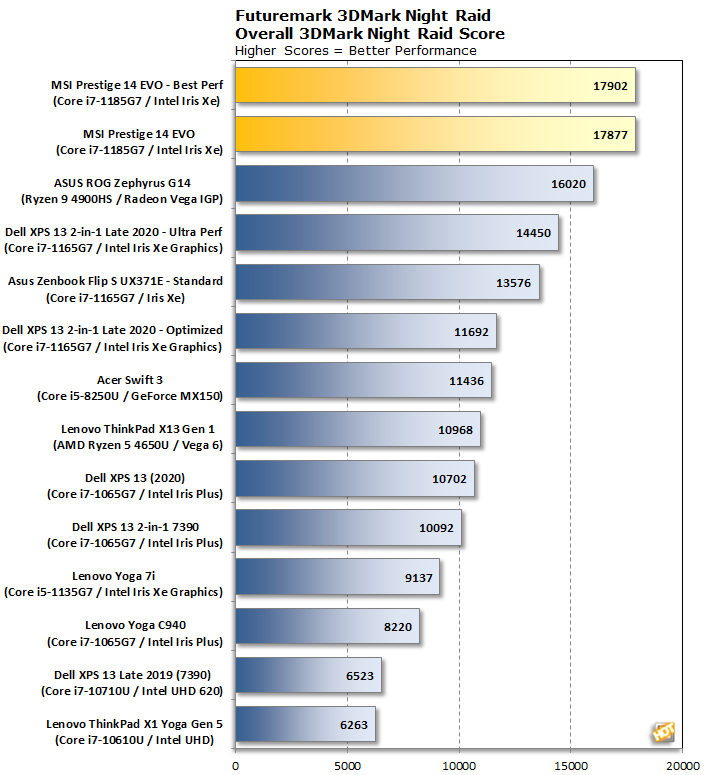
Sky Diver and Night Raid are both lighter-duty tests. Sky Diver targets the DirectX 11 API, and
finally the Prestige 14 EVO takes home a dominant 20% victory over the other Tiger Lake notebooks. The higher TDP no doubt pays off here, since this benchmark takes a while to run. The extra thermal headroom of the high-performance profile doesn't really help much, though. The DirectX 12 Night Raid test sees a similar margin of victory over the ASUS and Dell ultraportables, although the high-powered Ryzen 9 4900HS integrated GPU in the ASUS ROG Zephyrus G14 pushes within 10%. Regardless, both of these tests are nice, big victories.
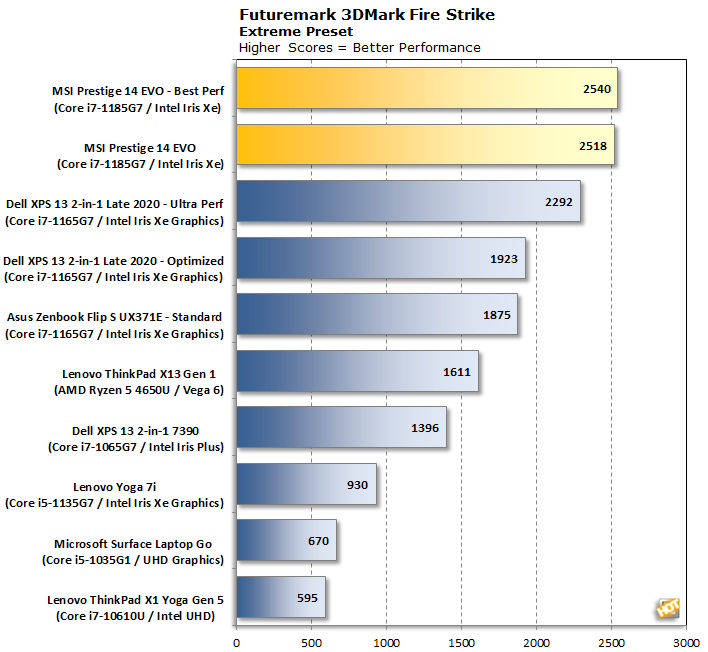
On the other hand, Fire Strike's Ultra preset can bring powerful desktop systems to their knees. Seeing the Prestige 14 EVO dominate once again is no surprise, thanks to its extra thermal headroom. Dell's XPS 13 9310 can push closer thanks to its Ultra Performance preset, and that's ground that MSI's top fan profile can't make up. When both systems are at their defaults, however, MSI scores over 25% better than the Dell on this test, and the same goes for the
ASUS ZenBook Flip S.
|
| GRID Autosport |
| Gaming Performance |
|
GRID Autosport is a cross-platform racing simulation developed by Codemasters. The developer wanted to make up for GRID 2, which released to mediocre reviews from critics and gamerse alike. Codemasters set out to improve
GRID Autosport's handling and environment rendering to make it a true racing simulator. The third GRID game is built on Codemasters' EGO engine that boasts more realistic physics and damage systems to add a bit of danger and some extra realism to the racing. Codemasters also tuned its graphics engine to perform well over a wide variety of mainstream systems, which makes it a great test for systems with integrated graphics. Codemasters also promotes that
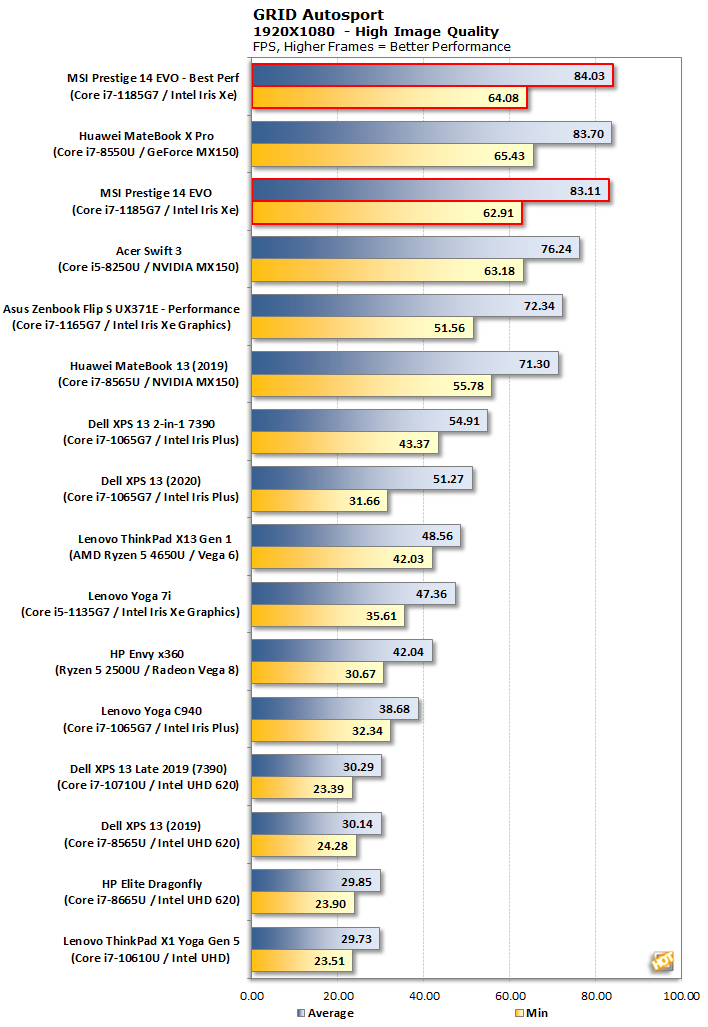
GRID Autosport is "optimized for integrated Intel HD Graphics", which is certainly something. We tested at 1080p with the High image quality preset.
MSI has no integrated competition in this title. Much like the 3DMark tests, this system is 20% faster than other Tiger Lake notebooks. It's also nearly three times as fast as systems stuck with Intel's old UHD Graphics solution, like the 10th gen XPS 13 from last year or the ThinkPad X1 Yoga Gen 5. Both of those systems have CPUs based on Coffee Lake with Gen 9.5 graphics.
|
| Gears Tactics |
| UE4 Gaming Performance |
|
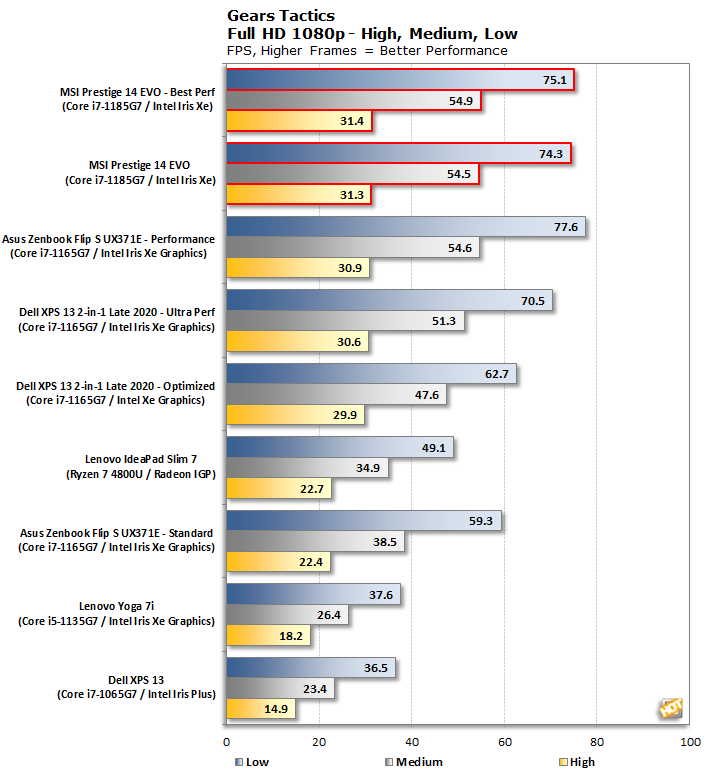
Gears Tactics is a much more recent title that runs on the Unreal 4 Engine. It's a pretty fun tactical real-time strategy game, and has a wide array of graphics options that can look pretty great if the system is up to the challenge. We turned off all the automatic frame rate adjustments, turned the resolution up to 1080p, and then tested at Low, Medium and High details settings.
In
Gears Tactics, all of the systems are good and warm before they ever get to the benchmark, since the game takes so long to load and navigate the menus. In this case, MSI puts up the best scores on the Medium and High presets, although it's not by much. On the Low setting, this notebook actually gets eclipsed by the 15 W Tiger Lake systems. We're not entirely sure why that's the case, as we had the latest drivers. We even let the system cool down between runs, yet none of those results varied much from these scores. It's not like performance is bad, though; 72 fps is more than the display can handle, and we might actually get less fan noise by turning on Vsync.
|
|
HotHardware Custom Video Loop |
|
Battery Life Performance |
|
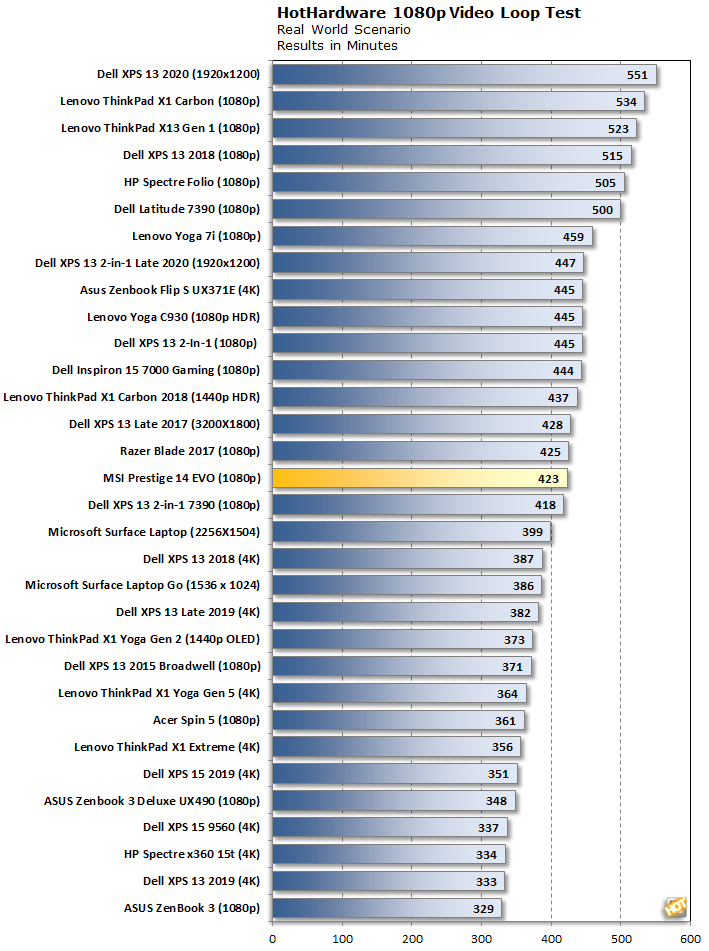
We run a custom 1080p HD video loop test developed in-house, to prove out battery life with our test group of machines. In all tests, Windows 10 Quiet Hours has been enabled and the displays are calibrated with lux meters on pure white screens to as close to 115 lux as possible. For the average laptop this is somewhere between a 40-60 percent brightness setting. In the case of the ThinkPad X13, this required lowering the brightness to 18 on the slider in the Windows 10 sidebar.
Despite its higher scores across the board in our performance benchmarks, the Prestige 14 EVO gives up very little in terms of battery longevity. The 52 Wh battery is approximately the same as what we found in the XPS 13 with Tiger Lake, and the higher-performance MSI machine only gives up around 5% battery life. Don't forget that the 14" display's 83.75 square inch footprint is around 5% larger than the 79.5 square inches of the Dell's 16:10 13.3" display too. In other words, we can chalk up part of the difference to the additional area the backlight has to illuminate. That means 423 minutes of battery endurance considering the system's performance level is pretty impressive. It may not last as long in a CPU-intensive scenario, but those typically run better while plugged in anyhow.
Next up it's time to dig into the system's internals and examine thermal performance before we wrap it up with our conclusions...