How We Configured Our Test Systems: We tested the graphics cards represented in this article on an ASUS Prime X299 Deluxe motherboard powered by a Core i9-10980XE 18-core / 36-thread processor and 32GB of HyperX DDR4 RAM clocked at 2,933MHz. The first thing we did when configuring the test system was enter the UEFI and set all values to their "high performance" defaults, then we disabled any integrated peripherals that wouldn't be put to use. The memory's clock was dialed in to its optimal performance settings using its XMP profile and the solid state drive was then formatted and Windows 10 Professional x64 was installed and fully updated. When the Windows installation was complete, we installed all of the drivers, games, applications and benchmark tools necessary to complete our tests.
|

|
| HotHardware's Test System |
| Intel Core i9 Powered |
|
Hardware Used:
Intel Core i9-10980XE
(3GHz - 4.4GHz, 18-Core / 36-Thread)
ASUS X299 Prime
(Intel X299 Chipset)
32GB Corsair DDR4-2933
Samsung SSD 970 EVO
Integrated Audio
Integrated Network
NVIDIA GeForce RTX 3090 FE
NVIDIA GeForce RTX 3080 FE
NVIDIA Titan RTX
NVIDIA GeForce RTX 2080 Ti FE
NVIDIA GeForce RTX 2080 Super
AMD Radeon RX 5700 XT
|
Relevant Software:
Windows 10 Pro x64 (v2004)
AMD Radeon Software v20.8.3
NVIDIA GeForce Drivers v456.16
Benchmarks Used:
IndigoBench v4
LuxMark v4_alpha0
SiSoft SANDRA 2020
Blender
OctaneBench / OctaneRender
VRMark
3DMark (Time Spy, Fire Strike, Port Royal)
Unigine Superposition
Crytek Neon Noir
Metro Exodus
Red Dead Redemption 2
Gears Tactics
Wolfenstein: Youngblood
FarCry: New Dawn |
|
|
| SiSoft SANDRA 2020 |
| Scientific Analysis And Image Processing OpenCL Tests |
|
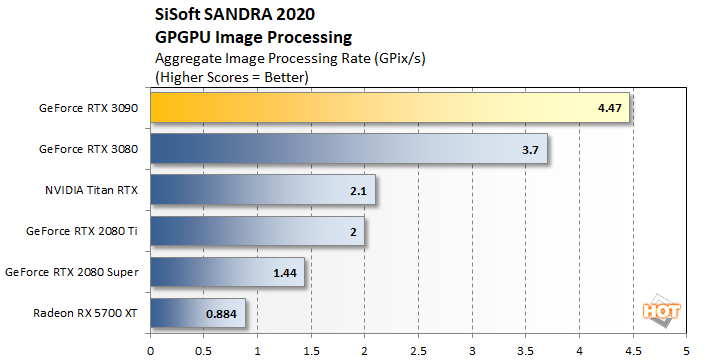
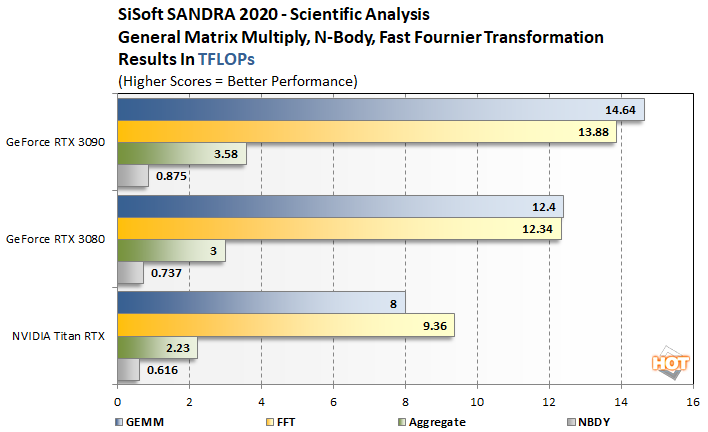
SANDRA's GPGPU Image Processing benchmark runs through an array of filters on its reference data and offers up an aggregate score, derived from a multitude of individual results. The Scientific Analysis benchmark runs though an array of General Matrix Multiply (GEMM), N-Body Simulations (NBDY), and Fast Fourier Transformation ops and reports the overall speed in FLOPs. CUDA and OpenCL code paths are available in these tests, but we used OpenCL on all cards to keep the playing field level. Previously, using the CUDA code path with
NVIDIA GPUs resulted in better performance, but OpenCL actually outperforms it in these tests now...
The GeForce RTX 3090 starts with a big lead right out of the gate in the SANDRA GPGPU image processing benchmark, outpacing the RTX 3080 by 21% and more than doubling the performance of the Titan RTX and 2080 Ti.
The Scientific Analysis tests also shows the GeForce RTX 3090 out in front of the GeForce RTX 3080 and Titan RTX, but its performance advantages are somewhat smaller. The RTX 3090 still blows past the Titan RTX, but only leads the RTX 3080 by about 7% - 18% depending on the test.
|
|
LuxMark v4.0_alpha0 |
|
OpenCL Benchmark |
|
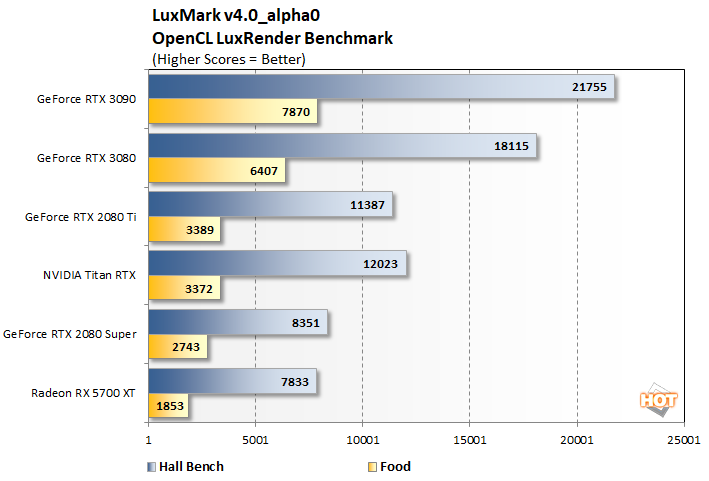
LuxMark is a cross-platform, OpenCL-accelerated 3D rendering benchmark. It's a tool based on the open source LuxRender physically-based spectral rendering engine, which accurately models the transportation of light and supports high dynamic range. LuxRender features a number of material types to allow rendering of photo-realistic and artistic scenes. LuxRender is free software, licensed under the GPL, that offers plugins for packages like Blender, Maya, Cinema 4D and 3DS Max.
In the latest (alpha) version of Luxmark, the GeForce RTX 3090 once again lands in the pole position, outrunning the GeForce RTX 3080 by about 21% and roughly doubling the Titan RTX's performance, give or take a few percentage points depending on the particular model being used.
|
|
IndigoBench |
|
GPU Rendering Performance |
|
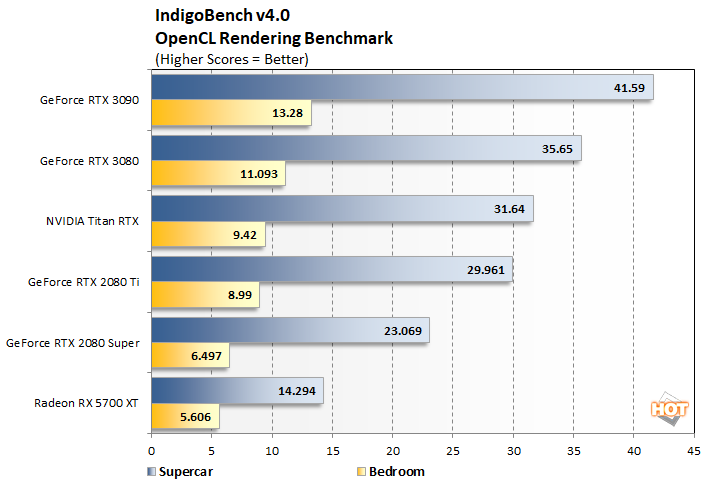
IndigoBench is based on Indigo 4's advanced rendering engine and offers both CPU and GPU rendering modes for its two built-in models. The standalone benchmark is available for Windows, MacOS, and Linux and outputs results in M/Samples per second.
The GeForce RTX 3090 leads the pack in IndigoBench, but by relatively small margins. Here, NVIDIA's new flagship is about 16.6% faster then
the RTX 3080 and roughly 31% faster than the Titan RTX. Obviously, the "lower end" cards fall in line after that.
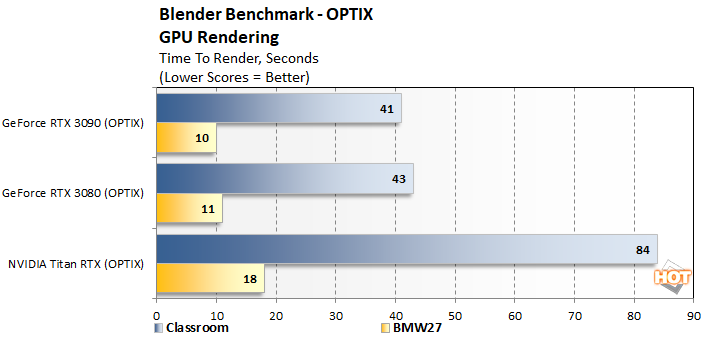
Blender is a free, open source 3D content creation tool that can handle everything from modeling, rigging, animation, simulation, rendering, compositing and motion tracking. It's developers have built a handy standalone benchmarking tool that will track the time it takes to rendering a handful of models, using various code paths. We used a couple of publicly available models for the public benchmark, but also ran a more taxing workload to highlight one of the GeForce RTX 3090's strengths.
In the two charts above, we have results from BlenderBench using the Classroom and BMW models, using either the CUDA or OPTIX code paths. CUDA obviously leverages the GeForce's
CUDA cores, while OPTIX also incorporates the RT engines. Here, the GeForce RTX 3090 is about 16% faster than the RTX 3080 when using CUDA. That lead shrinks down to the less than 5% using OPTIX. However, both cards are much faster than the Titan RTX.
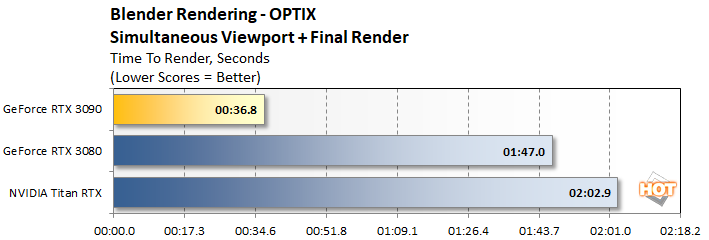
Moving over to a larger, much more complex model and performing a simultaneous viewport and final renders with Blender tells a totally different story. With this workload, the GeForce RTX 3090's additional compute resources and 24GB frame buffer come into play, and it ends up being roughly 3x - 4x faster than the GeForce RTX 3080 or Titan RTX.
|
| OctaneBench / OctaneRender |
|
Testing Rift And Vive Readiness |
|
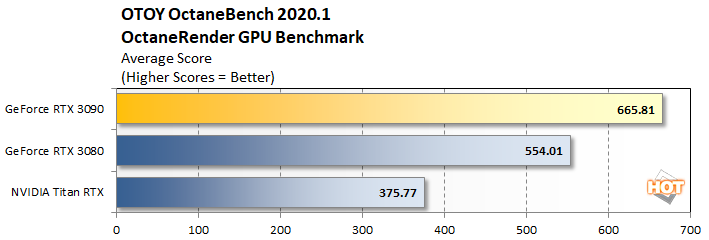
OTOY's OctaneBench is a standalone tool that gives users the ability to benchmark CPUs or NVIDIA GPUs using the company's OctaneRender engine. This tool leverages the RT cores inside the
GPUs when available and runs through a series of models to produce an overall, average score. Like Blender, we also used the actual OctaneRender application to tests a heavier workload than what is included with the standard benchmark.
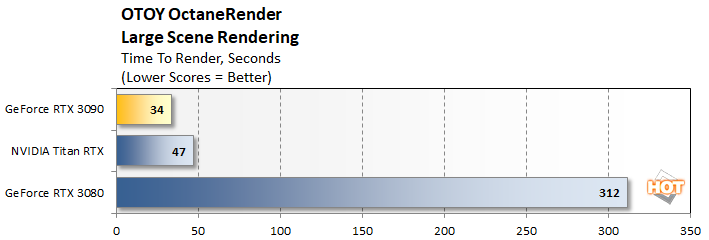
With OctaneBench, the GeForce RTX 3090 finishes about 20% faster than the GeForce RTX 3080 and nearly 80% faster than the Titan RTX. But what happens when the model being rendered is too big to fit in the graphics card's on-board memory and has to spill out into system memory? Let's find out...
With a large scene rendering, the Titan RTX and GeForce RTX 3080 trade places, and the RTX 3080 falls off a cliff. Because both the Titan RTX and GeForce RTX 3080 have 24GB of RAM on-board, they're able to process this workload much faster, because they don't need to swap and fetch any data from much slower system memory. As a result, both the
Titan RTX and GeForce RTX 3090 finish many times faster than the RTX 3080 (about 8x - 9x faster, in fact). Even still, the GeForce RTX 3090 outruns the Titan RTX by over 38%.