Samsung SSD 870 EVO Review: The Fastest SATA SSDs Yet
Samsung SSD 870 EVO: High-Capacity V-NAND For Huge Capacites

These new TLC-based drives also offer slightly higher performance than their QLC-based predecessors, with longer warranties and better endurance ratings as well. Take a look at the Samsung SSD 870 EVO series’ full list of features of specifications below, and then we’ll dig in a bit further on the particulars and look at performance...

|
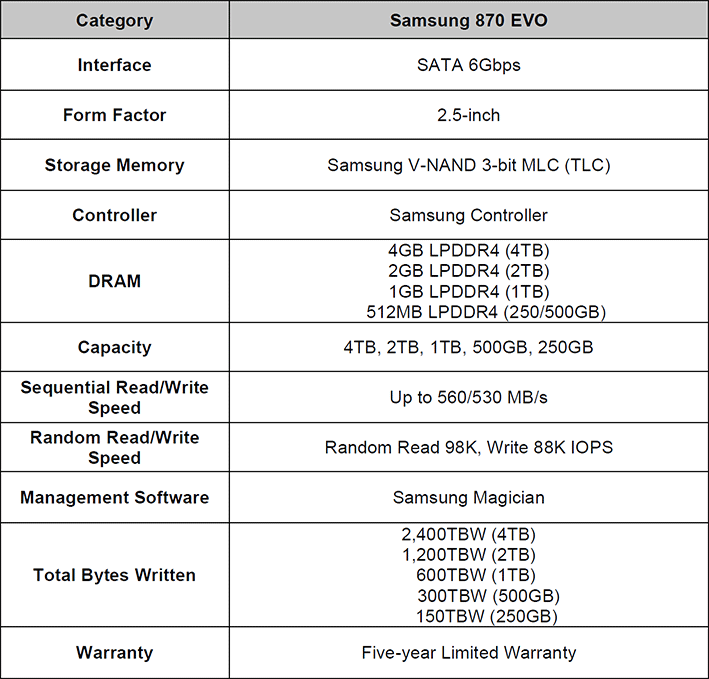
The Samsung SSD 870 EVO series of drives are built around the company's latest 100+-layer, 3-bit per cell TLC (triple level cell) V-NAND. That NAND is paired to a proprietary Samsung MKX controller and some LPDDR4 DRAM cache. Details are scarce on the controller itself, but the amount of DRAM installed on each drive is listed right in their specs – there is essentially 1GB of DRAM per 1TB of drive capacity.


Three pentalobe screws secure the enclosures together – one screw is visible and two reside under the decal. Disengage those screws and the enclosures pops right open to reveal the PCBs inside; there is no adhesive, thermal pads, or thermal interface material to speak of in these designs.


Samsung SSD 870 EVO Benchmarks
Under each test condition, the SSDs tested here were installed as secondary volumes in our testbed, with a separate drive used for the OS and benchmark installations. Out testbed's motherboard was updated with the latest BIOS available at the time of publication. The SSDs were secure erased prior to testing (when applicable), and left blank without partitions for some tests, while others required them to be partitioned and formatted, as is the case with the ATTO, PCMark, and CrystalDiskMark tests. Windows firewall, automatic updates, and screen savers were all disabled before testing and Windows 10 Quiet Hours / Focus Assist was enabled. In all test runs, we rebooted the system, ensured all temp and prefetch data was purged, waited several minutes for drive activity to settle, and for the system to reach an idle state before invoking a test.

|
| Processor - Motherboard - Video Card - Memory - Audio - Storage - |
AMD Threadripper 3990X MSI TRX40 Creator (TRX40 Chipset) GeForce RTX 2080 Ti 32GB G.SKILL DDR4-3200 Integrated on board Corsair MP600 (OS Drive) Samsung SSD 860 Pro (2TB) Samsung SSD 870 QVO (1TB, 2TB) Toshiba OCZ VX500 (1TB) Samsung SSD 870 EVO (1TB, 4TB) |
OS - Chipset Drivers - DirectX - Benchmarks - |
Windows 10 Pro x64 (1909) AMD v2.10.13.408 DirectX 12 HD Tune v5.75 ATTO v4.01.0f AS SSD CrystalDiskMark v7 x64 PCMark 10 Quick Storage Bench SiSoftware SANDRA |
|
|
ATTO is another "quick and dirty" type of disk benchmark that measures transfer speeds across a specific volume length. It measures raw transfer rates for both reads and writes and graphs them out in an easily interpreted chart. We chose .5KB through 64MB transfer sizes and a queue depth of 4 over a total max volume length of 256MB. ATTO's workloads are sequential in nature and measure raw bandwidth, rather than I/O response time, access latency, etc.
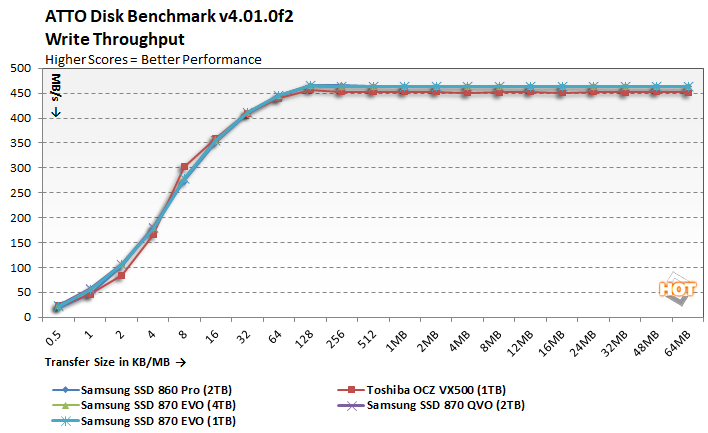
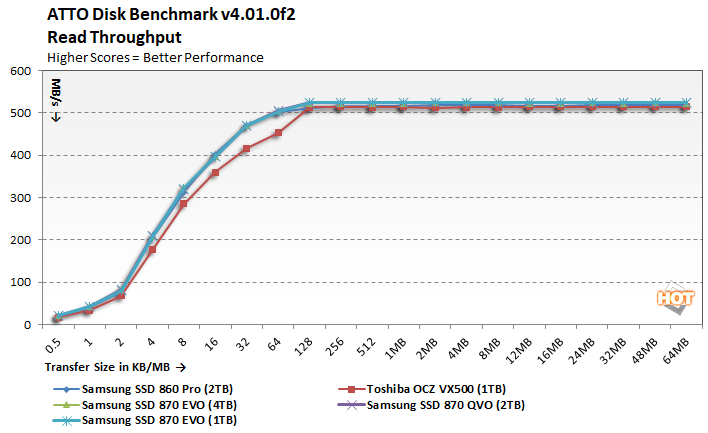
In ATTO's read and write bandwidth tests, the new Samsung SSD 870 EVO drives competed at the top of the charts, across the entire curve. The drives bump into the limits of the legacy SATA interface, however, as expected.
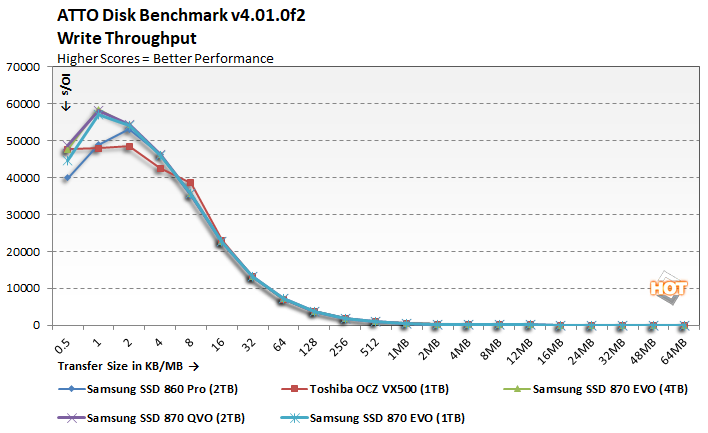
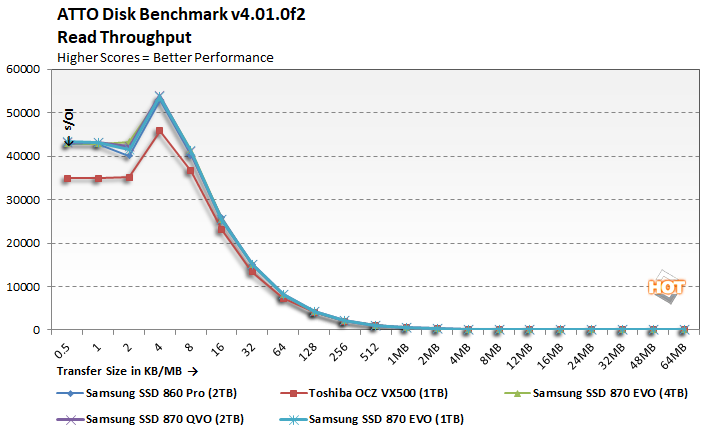
There's not much separating these SSDs in terms of IOs either. Save for the previous-gen Samsung SSD 860 Pro and OCZ drives, which trail slightly with the smallest transfer sizes, all of the Samsung drives once again perform similarly overall.
|
Next up we ran the Compression Benchmark built-into AS SSD, an SSD specific benchmark being developed by Alex Intelligent Software. This test is interesting because it uses a mix of compressible and non-compressible data and outputs both Read and Write throughput of the drive. We only graphed a small fraction of the data (1% compressible, 50% compressible, and 100% compressible), but the trend is representative of the benchmark’s complete results.
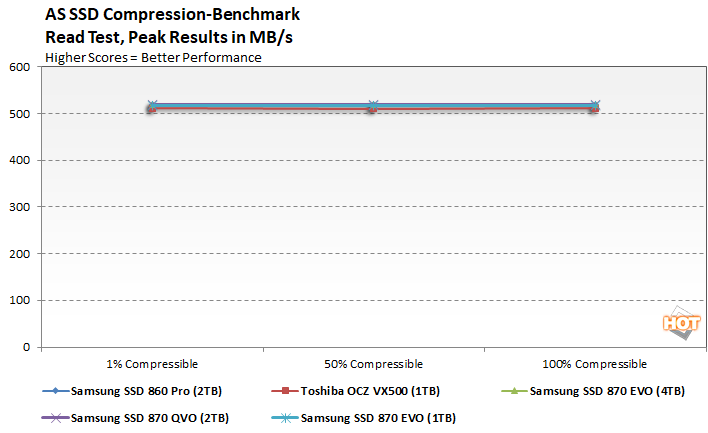
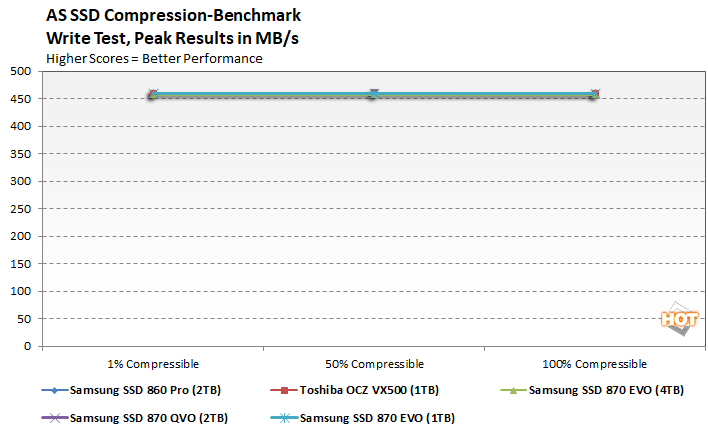
There's no exceeding the limits of the interface in this test but there's nuance to the performance of these new Samsung SSDs, which you'll see next...


