Our Test Methods: Under each test condition, the SSDs tested here were installed as secondary volumes in our testbed, with a separate drive used for the OS and benchmark installations. Out testbed's motherboard was updated with the latest BIOS available at the time of publication and AHCI mode was enabled for the host drive. The SSDs were secure erased prior to testing (when applicable), and left blank without partitions for some tests, while others required them to be partitioned and formatted, as is the case with the ATTO, PCMark, and CrystalDiskMark tests. Windows firewall, automatic updates, and screen savers were all disabled before testing and Windows 10 Quiet Hours / Focus Assist was enabled.
In all test runs, we rebooted the system, ensured all temp and prefetch data was purged, waited several minutes for drive activity to settle, and for the system to reach an idle state before invoking a test. All of the drives featured here were tested with their own
NVMe drivers installed where possible / available, but the default Windows 10 NVMe driver was used when a proprietary driver was unavailable. Also note, we have completely revamped our test bed, so the numbers shown in this review aren’t comparable to previous articles. All of the drives here have also been updated to their latest firmware and where applicable.
 |
| HotHardware Test System |
| Intel Core i7 and SSD Powered |
|
Processor -
Motherboard -
Video Card -
Memory -
Audio -
Storage -
|
Intel Core i9-9900K
Gigabyte Z390 Aorus Master
(Z390 Chipset, AHCI Enabled)
Intel HD 630
16GB G.SKILL DDR4-2666
Integrated on board
Corsair Force GT (OS Drive)
Toshiba BG4 (1TB)
Samsung SSD 970 EVO Plus (1TB)
Kingston KC200 (1TB)
WD Blue SN500 (500GB)
WD Black SN750 (1TB)
Crucial P1 (1TB) |
OS -
Chipset Drivers -
DirectX -
Benchmarks - |
Windows 10 Pro x64 (1903)
Intel 10.1.17.86, iRST 17.0.0.1072
DirectX 12
IOMeter 1.1
HD Tune v5.70
ATTO v4.00.0f2
AS SSD
CrystalDiskMark v6.0.2 x64
PCMark Storage Bench 2.0
SiSoftware SANDRA |
|
| IOMeter |
| I/O Subsystem Measurement Tool |
|
As we've noted in previous SSD articles, though IOMeter is clearly a well-respected industry standard drive benchmark, we're not completely comfortable with it for consumer testing SSDs. The fact of the matter is, though our results with IOMeter scale, it is debatable whether or not certain access patterns, as they are presented to and measured on an SSD, actually provide a valid example of real-world performance. The access patterns we tested may not reflect your particular workload, for example. That said, we do think IOMeter is a reliable gauge for relative available throughput with a given storage solution. In addition, there are certain higher-end workloads you can place on a drive with IOMeter, that you can't with most other storage benchmark tools available currently.
In the following tables, we're showing two sets of access patterns; a custom Workstation pattern, with an 8K transfer size, consisting of 80% reads (20% writes) and 80% random (20% sequential) access and a 4K access pattern with a 4K transfer size, comprised of 67% reads (33% writes) and 100% random access. Queue depths from 1 to 32 were tested, though keep in mind, most consumer workloads usually reside at low queue depths...
The BG4 hangs with the
WD Blue SN500 here at QD1, but once the queue depth increases, all of the other drives pull away from the BG4. This is the case with both access patterns we tested.
The actual latency and bandwidth numbers show the BG4 leading the
WD Blue with the workstation access pattern, which incorporates some sequential transfers, but it trails in the fully-random 4K access pattern.
|
| AS SSD Compression Benchmark |
| Bring Your Translator: http://bit.ly/aRx11n |
|
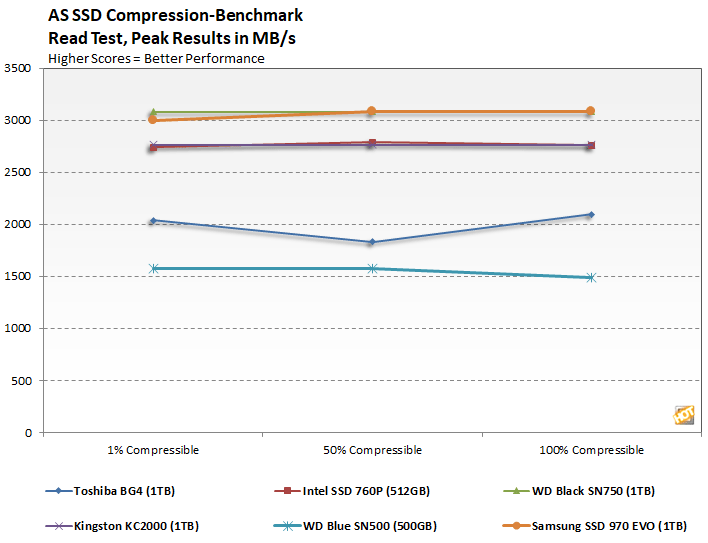
Next up we ran the Compression Benchmark built-into AS SSD, an SSD specific benchmark being developed by Alex Intelligent Software. This test is interesting because it uses a mix of compressible and non-compressible data and outputs both Read and Write throughput of the drive. We only graphed a small fraction of the data (1% compressible, 50% compressible, and 100% compressible), but the trend is representative of the benchmark’s complete results.
The compressibility of the data being transferred across the BG4 has a minimal impact on performance. Once again, we see the drive outpacing the WD Blue in the read test and it manages to outpace the Intel SSD 760P and the WD drive with writes.