Alienware Area-51 R5 (2018) Review: Liquid Cooled GPUs, Skylake-X Firepower
Area-51 R5: Cinebench, POV-Ray, and PCMark
We will start our benchmarking off with some standard workloads before bringing in the gaming goodness.
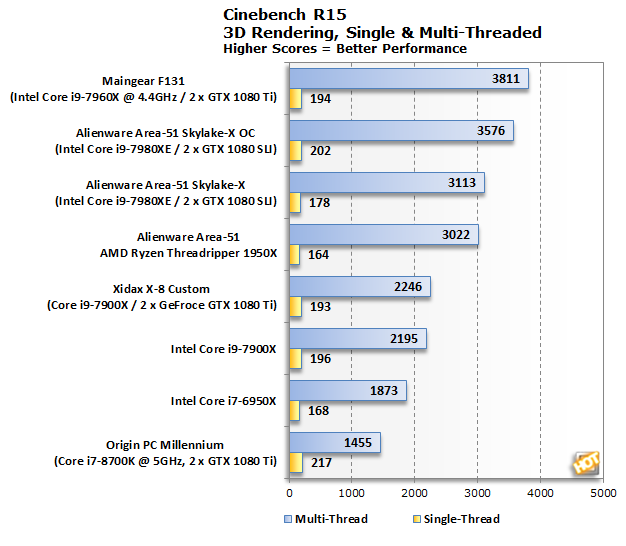
Cinebench yields our first look into the power of overclocking. Even with Alienware’s modest OC profile, the Area-51 gains 435 points, an improvement of about 14%. On the single-core side of things, the overclocked Area-51 takes top marks thanks to the 4.7GHz clock speeds, which does bode well for gaming and other lightly-threaded workloads.
What’s more questionable is how the Area-51 trails the likes of the Maingear F131’s Core i9-7960X. It appears the default VccIN for the CPU is ever so slightly too low. We tested raising the VccIN by a tick from 1.829V to 1.835V and were able to surpass 3800 when also raising the Turbo Boost Power Max. We will note that raising the Turbo Boost Power max alone would not score over 3600. With a little more voltage, scores of 4000+ were achievable.
Regardless, in keeping with our earlier promises, we are sticking with the built-in profiles. Just keep in mind that significant performance gains can be unlocked with a little extra tinkering.

We have a stash of reference CPU results for POV-Ray so we can see if any funny business is going on with our i9-7980XE. As with Cinebench, the results are underwhelming. The Stock profile comes in 550 pixels per second behind the reference i9-7980XE we reviewed at its launch.
With the OC profile applied, the Area-51 beats out the reference chip by a hair over 300 pixels per second. It is about a 5% improvement, which is nothing to scoff at, but is not as strong as we may have hoped.
PCMark 8 brings better tidings. Its mixed workload does not fully stress the CPU thermally but does give the whole system a decent workout. As a result, we find the Area-51 performing well in the pack and even vying for the top spot when overclocked. We do not like to read too much into PCMark 8, naturally, but suffice to say the productivity potential is strong.
While we lack comparison data points, we also ran PCMark 10 for good measure. While all scores improve with the overclock, the Productivity subtest really brings some gains.
Cinebench R15
Based on Maxon Cinema 4D software, this test uses a 3D scene and polygon and texture manipulation to assess GPU and CPU performance. We ran the Main Processor Performance (CPU) test, which builds a still scene containing about 2,000 objects, for a total polygon count above the 300,000 mark. Here we're focusing strictly on software rendering on the CPU and it's heavily taxing on this one aspect of system performance, both with multi-threaded and single-threaded rendering.Cinebench yields our first look into the power of overclocking. Even with Alienware’s modest OC profile, the Area-51 gains 435 points, an improvement of about 14%. On the single-core side of things, the overclocked Area-51 takes top marks thanks to the 4.7GHz clock speeds, which does bode well for gaming and other lightly-threaded workloads.
What’s more questionable is how the Area-51 trails the likes of the Maingear F131’s Core i9-7960X. It appears the default VccIN for the CPU is ever so slightly too low. We tested raising the VccIN by a tick from 1.829V to 1.835V and were able to surpass 3800 when also raising the Turbo Boost Power Max. We will note that raising the Turbo Boost Power max alone would not score over 3600. With a little more voltage, scores of 4000+ were achievable.
Regardless, in keeping with our earlier promises, we are sticking with the built-in profiles. Just keep in mind that significant performance gains can be unlocked with a little extra tinkering.
POV-Ray
POV-Ray, or the Persistence of Vision Ray-Tracer, is an open source tool for creating realistically lit images. We tested with POV-Ray's standard 'one-CPU' and 'all-CPU' benchmarking tools on all our test machines and recorded the scores reported for each. Results are measured in pixels-per-second throughput; higher scores equate to better performance.
We have a stash of reference CPU results for POV-Ray so we can see if any funny business is going on with our i9-7980XE. As with Cinebench, the results are underwhelming. The Stock profile comes in 550 pixels per second behind the reference i9-7980XE we reviewed at its launch.
With the OC profile applied, the Area-51 beats out the reference chip by a hair over 300 pixels per second. It is about a 5% improvement, which is nothing to scoff at, but is not as strong as we may have hoped.
PCMark
PCMark 8 simulates the workloads computers face in several different settings, including home, office and content creation. The benchmark also has a test that simulates a creative professional’s usage, as well as battery and storage tests. We ran the tests with OpenCL acceleration enabled to leverage the power of the system's GPU, CPU and storage subsystem combined.
PCMark 8 brings better tidings. Its mixed workload does not fully stress the CPU thermally but does give the whole system a decent workout. As a result, we find the Area-51 performing well in the pack and even vying for the top spot when overclocked. We do not like to read too much into PCMark 8, naturally, but suffice to say the productivity potential is strong.

While we lack comparison data points, we also ran PCMark 10 for good measure. While all scores improve with the overclock, the Productivity subtest really brings some gains.


