ASUS TUF Gaming A15 Review: Ryzen Power With GeForce RTX Pop
ASUS TUF Gaming A15: Web and Productivity Benchmarks

As always, we endeavor to get clean numbers by configuring review test systems similarly, but there are always inevitable differences across notebooks from different vendors. We ran Windows Update until the software patches were all applied, and the latest drivers were installed for each machine. Since these are laptops and heat can become a factor quickly, we allowed each system to cool down and reach an idle state in between runs. For the ASUS TUF Gaming A15, we tested using both the default Performance and Turbo profiles, and each chart has both results clearly marked.
|
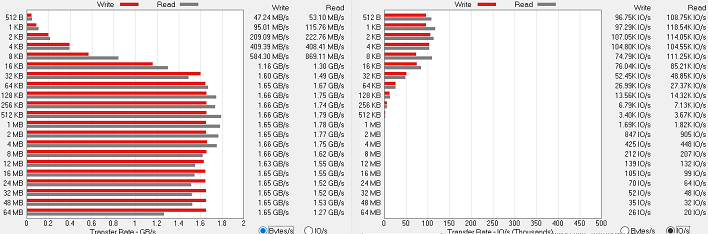
The drive in our review sample of the TUF Gaming A15 is a 1 TB Intel 660p, which is a PCI Express 3.0 NVMe drive in an M.2 2280 form factor with Intel's 64-layer 3D QLC NAND. As a result, it's not the fastest drive on the planet, but it certainly did a decent job on the sequential read and write tests within ATTO. Maxing out at 1.75 GB per second reads and 1.6 GB per second writes is pretty solid performance. Boot time of the machine is pretty speedy, and most apps open in the blink of an eye, just like you'd want.
On the IOPS side, the drive maxes out in this test at around 110,000 IOPs. That number drifts off as the write speeds increase because each transaction requires moving more data, so there's no problem here.
|
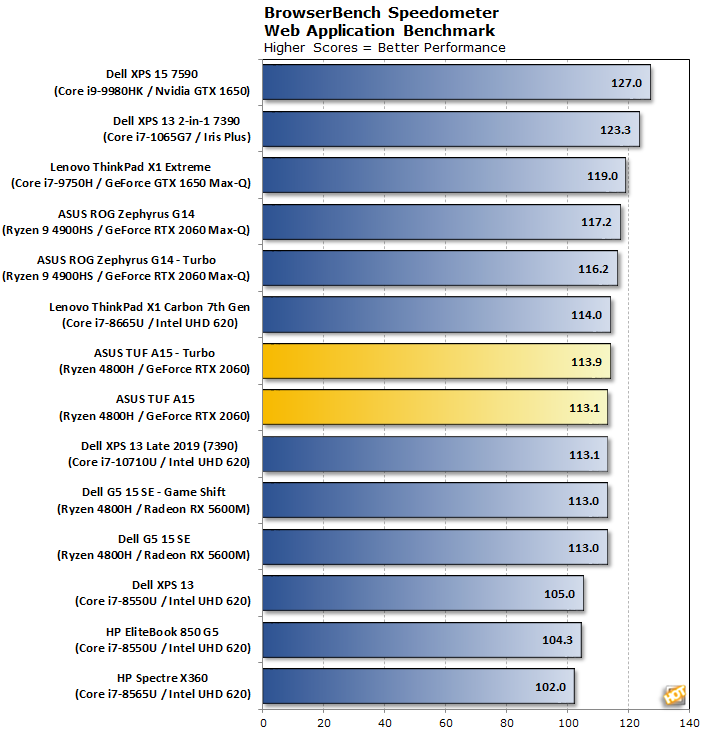
Here in our first test we see a neck-and-neck race between the TUF Gaming A15 and the similarly-priced Dell G5 15 SE, which makes sense because they both have the same CPU and memory configuration. The A15 trails the ROG Zephyrus G14 here a little bit, most likely because of the burst-happy nature of the test and that the G14's Ryzen 9 4900HS CPU has a slightly higher boost clock. All of these systems are plenty fast on the internet, though.
It seems Turbo doesn't help web browsing tasks, likely due to the fact that most web browsing tasks are lightly threaded. The CPU can likely hit peak performance for short periods of time without the extra fan headroom. We'll keep an eye on it, though, because we expect this to change in multi-threaded tests.
|

In the older Cinebench test, the TUF Gaming A15 basically matches the other ASUS-made Ryzen system, the Zephyrus G14. The CPU test is heavily multi-threaded, and as a result there's a clear difference between the Intel and AMD systems on this list, outside of the desktop-caliber Core i9-9900K which roosts at the top. When it comes to mainstream mobile CPUs, however, AMD puts up great numbers. Turbo can only add around 1% to the score, which is measurable but not the sort of thing you'd feel.
On the OpenGL side of things, the GeForce RTX 2060 in the A15 is not the best performer on this list, but this workload is not typical for a gaming laptop, either. Still, this system performs roughly as well as its counterpart in the G14. Turbo helped, but again the gain was minimal. This time it was a 4% increase, which is unlikely to be noticeable. Dell's Ryzen and Radeon powered laptop takes a win in that test, though.
The latest version of Maxon's rendering benchmark, Cinebench R20, takes longer to complete, so this is a better test of a notebook's cooling system. This release also drops the OpenGL test, making Cinebench a pure CPU benchmark this time. We tested both single-threaded and multi-threaded performance here.
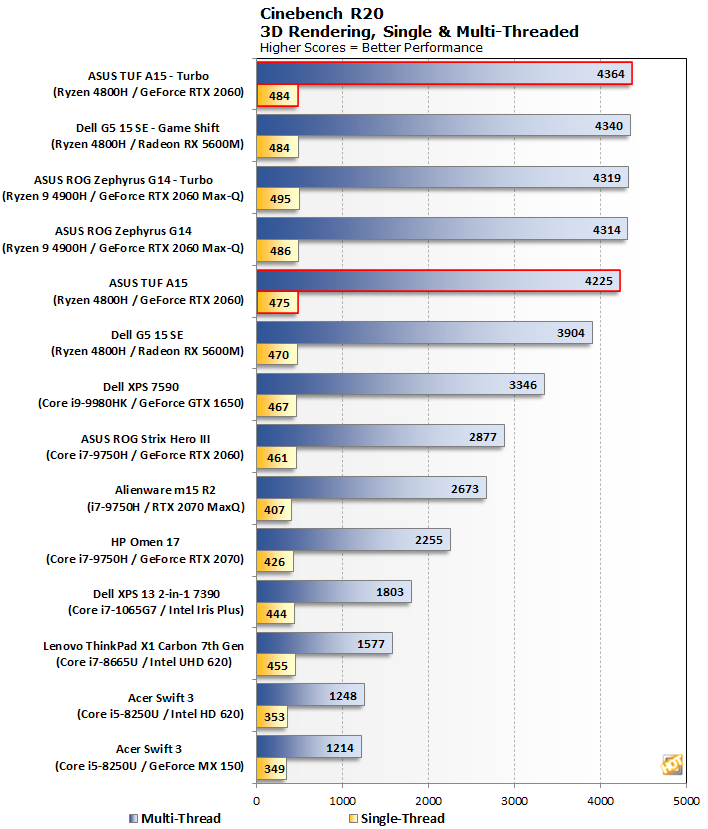
In the newer, more intensive Cinebench test, the TUF Gaming A15 bookends most of the other Ryzen systems on our chart, but the default profile against Dell's default profile gives ASUS a pretty sizable win of 8% with multi-threading enabled. Somewhat surprisingly, the A15 is also the fastest notebook overall in this test, which is no small feat.
Perhaps because this test isn't as burst-oriented as the web benchmark, the gains in the single-threaded tests are a little more visible, but we're still talking two to three percentage points. Considering the default Performance profile's performance in this test, that means that ASUS was already getting as much as it could out of this CPU, and (spoiler alert) the extra fan noise isn't really worth the small performance gains. How much fan noise, you ask? We'll talk about that in just a bit.
|
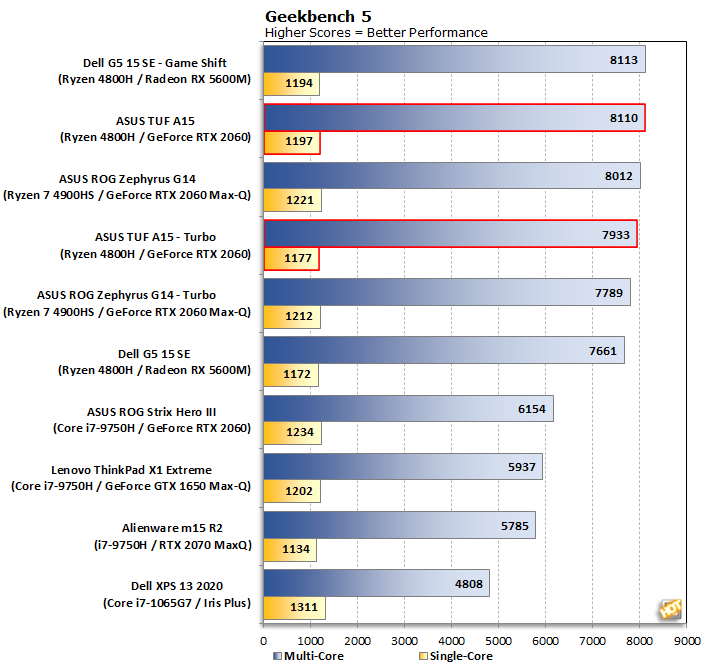
Geekbench was kind of an odd test for our ASUS contestants. Turbo mode was slower than the Performance profile on the ROG Zephyrus G14, and again that's true for the TUF Gaming A15. It's counterintuitive, since the extra fan headroom should allow faster performance, but this was consistent across multiple runs even after a cooldown period. All of these AMD-based systems are jammed together in a 3% spread, so this test is more about AMD dominating and less about which particular implementation rules the roost.
|
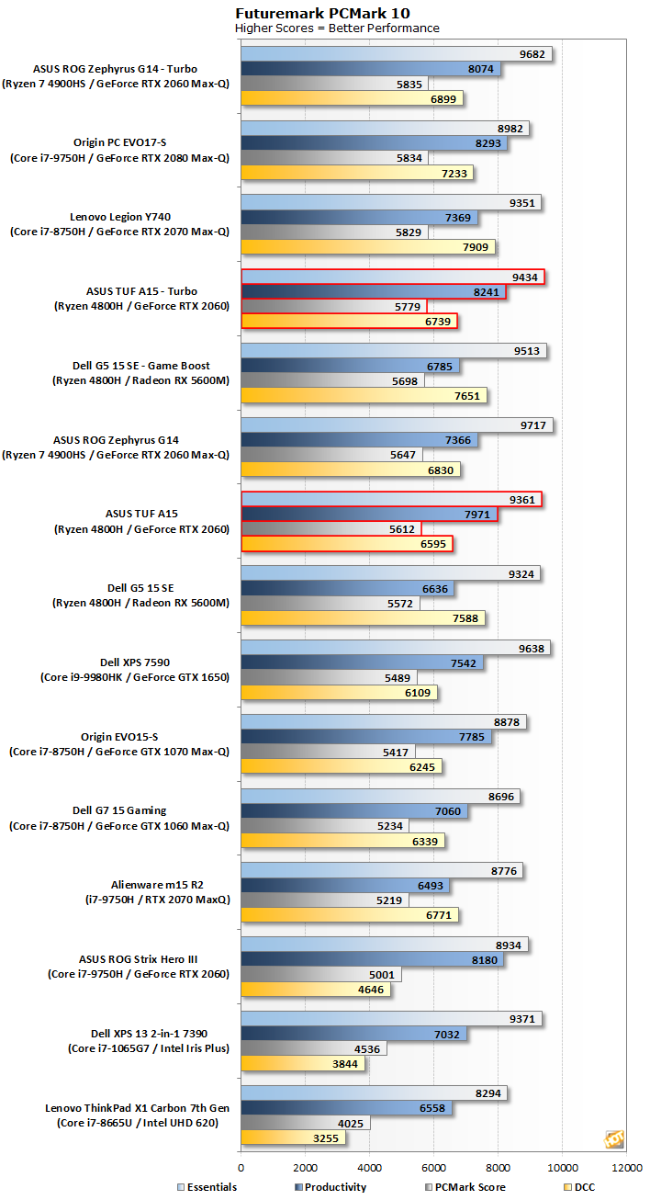
In PCMark, the TUF Gaming A15 hung tough with the other Ryzen-based systems on our chart. This series of tests pushes the whole system, including storage, CPU, and even graphics on a few occasions. Both with and without Turbo, the A15 edged out the Dell G5 15 SE by just the slimmest of margins on each test as well as overall.
While performance overall is great, the ASUS TUF Gaming A15 did particularly well in the Productivity tests. This suite employs office apps like word processing and spreadsheets, so it focuses on the CPU and storage IO throughput. With the Turbo performance profile enabled, the TUF Gaming A15 posted our second-highest score, only behind the smaller, pricier Zephyrus G14.
Overall productivity performance is pretty great here. Next up we'll take a look at its all-important gaming in 3DMark and several games, and also look at battery life.


