We tested the Dell OptiPlex 7070 Ultra as it shipped to ensure we get the same out-of-box experience as your average end-user, with the latest Windows updates installed. Many variables can affect performance, so our comparisons should serve as a reference point. Our benchmarking kicks off with storage, content creation, and web browsing benchmarks to get an idea how the system performs in everyday tasks.
 |
ATTO Disk Benchmark
|
Peak Sequential Storage Throughput
|
|
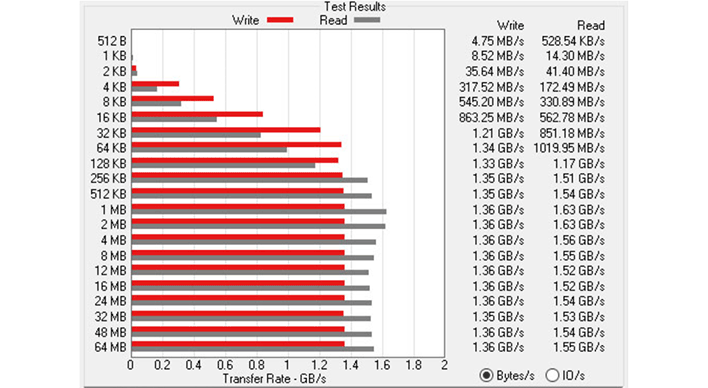
Storage performance is important when it comes to a snappy everyday user experience and ATTO Disk Benchmark provides a quick glimpse into how a system should perform. Dell installs a
512GB Western Digital SN520, which is a relatively low-end, small form factor NVMe SSD. WD rates the SN520 for 1,700MB/s read and 1,400MB/s write speeds, which doesn’t seem very quick, but its limited to a PCIe x2 interface.
Performance is as expected from the WD SN520. ATTO shows the SSD peaking at 1.63GB/s reads and 1.36GB/s writes, which is near the drive’s rated speed. It’s no speed-demon, but it's got much better sequential performance than any SATA drive and should be sufficient for day-to-day usage.
 |
| Speedometer Web Application Benchmark |
| Browser Performance |
|
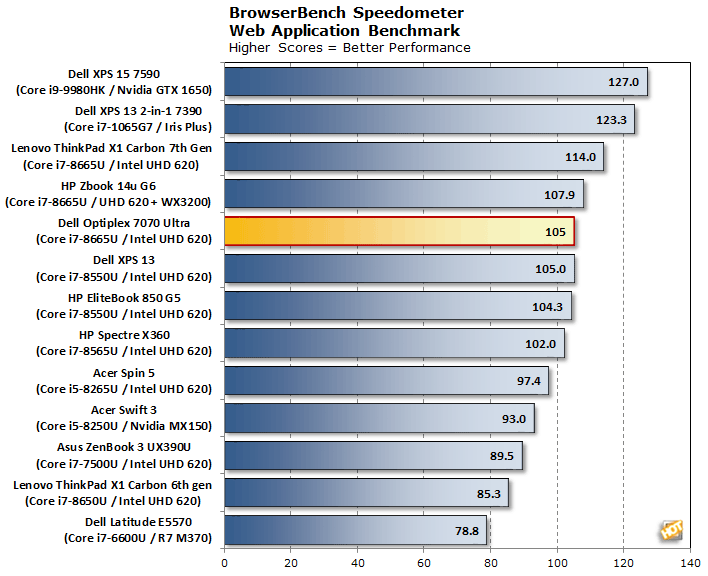
BrowserBench.org’s Speedometer test provides a holistic look at web app performance. The benchmark tests several webapps from ToDoMVC.com using your typical web frameworks. The test was performed using the latest version of Google Chrome.
The
Dell OptiPlex 7070 Ultra’s Speedometer performance is comparable to other Core i7-8665U and 8550U-powered systems. Intel’s latest Ice Lake Core i7-1065G7 has a 17% advantage over the older Whiskey Lake in the Dell, but it’s no slouch.
|
Cinebench R15 & R20
|
3D Rendering On The CPU And GPU
|
|
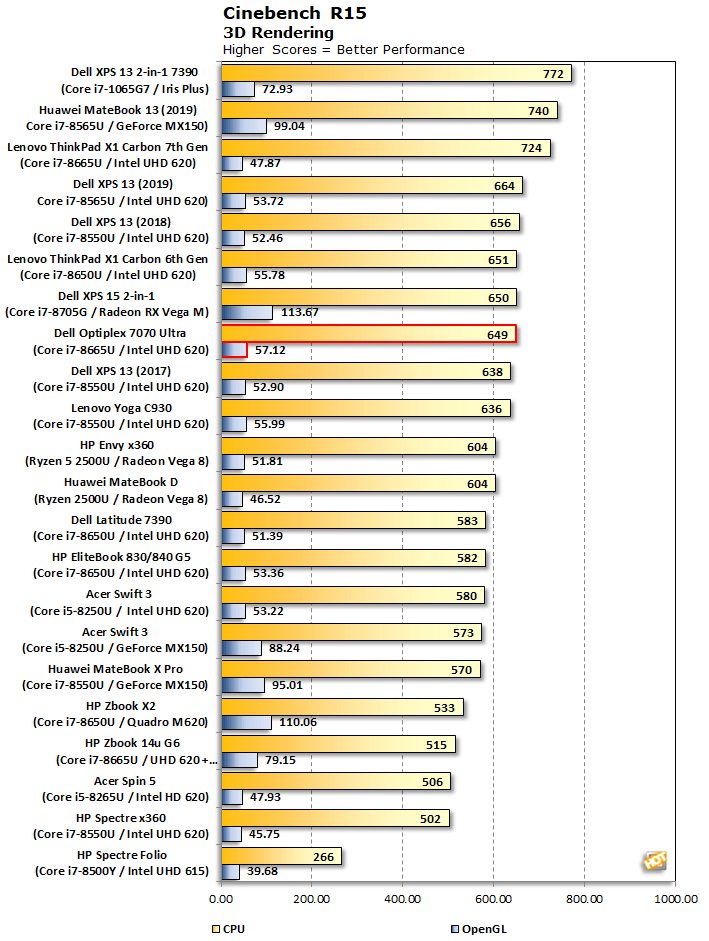
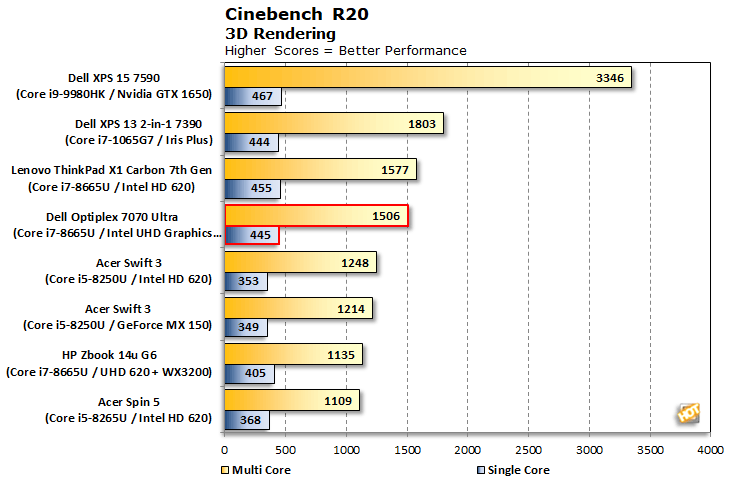
Cinebench tests the CPU and GPU independently and provides a glimpse into the system's throughput. The test is based on Maxon’s Cinema 4D modeling software that’s used in movie production studios.
Cinebench R15 and R20 don’t provide any performance surprises either. The Dell OptiPlex 7070 Ultra performs in-line with other similar Whiskey Lake-powered notebooks. It also shows Ice Lake has nearly a 20-percent advantage in CPU performance and 28-percent advantage in GPU, leaving us wishing Intel was shipping
Intel 10th Gen processors with vPro inside these innovative little machines.
|
| Geekbench 4 |
| Single and Multi-Core Performance |
|
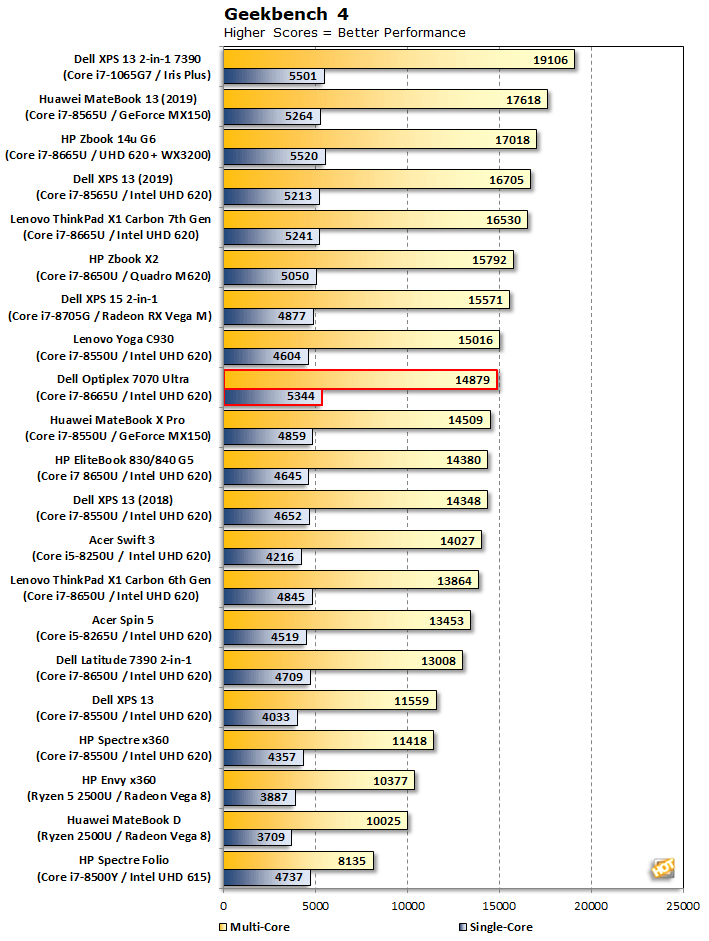
Geekbench 4 is a cross-platform benchmark that simulates real world processing workloads in image processing and particle physics scenarios. We tested the Dell OptiPlex 7070 Ultra in Geekbench 4’s single and multi-core test workloads.
Geekbench 4 is a lot more telling with the OptiPlex 7070 Ultra’s thermal abilities. While the OptiPlex can slightly flex its turbo clocks in the single-core tests for a teeny 2-percent advantage over the
Lenovo ThinkPad X1 Carbon 7th Gen. Its not able to sustain the turbo clocks in multi-core, falling behind the similarly-equipped Lenovo by 10-percent, unfortunately.