Before running our selection of benchmarks, we apply the latest Windows and driver updates to the system we are testing (in this case, the 2021 Dell XPS 17 9710). Our system shipped with Windows 10 Home with the 20H2 update, and we updated to 21H1 as part of our test process. Other than that, we run all our tests with out-of-the-box settings. Our goal is to test the system as it ships, but after auto-updating, to accurately reflect what buyers can expect from a retail experience. The big comparison here to watch is with ASUS Zephyrus ROG M16 and its 80-100 Watt version of the GeForce RTX 3060 and its own Tiger Lake-H CPU.
 |
| ATTO Disk Benchmark |
| Peak Sequential Storage Throughput |
|
The
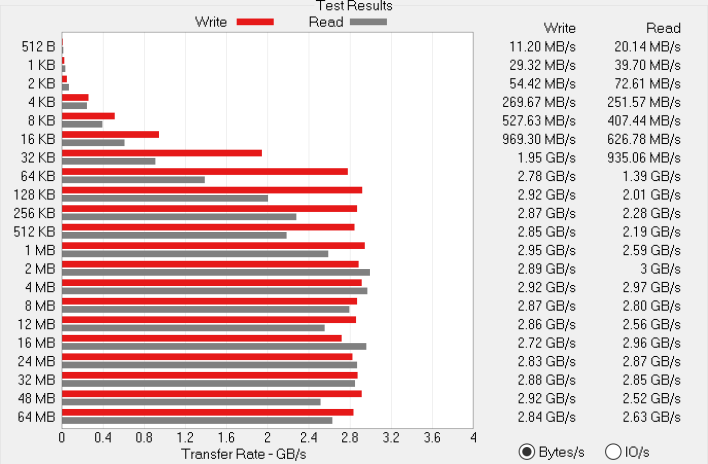
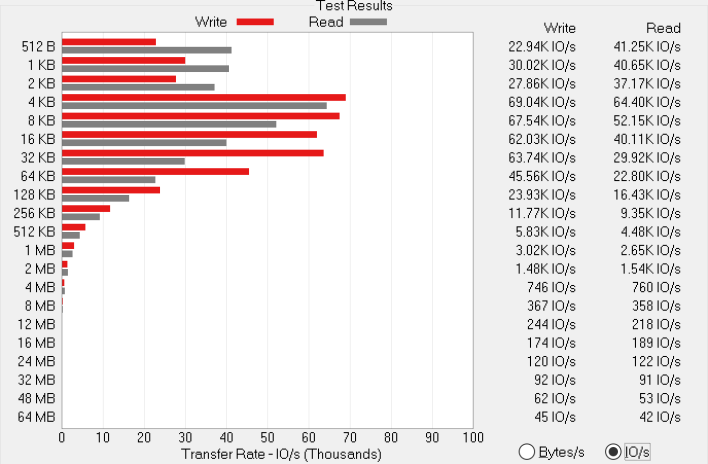
ATTO disk benchmark is a fairly quick and simple test which measures read/write bandwidth and IOPS across a range of different data sizes. While we don't typically compare these results across multiple machines, it's useful to gauge whether a particular notebook's storage subsystem can handle being put under pressure.
Our XPS 17 9710 review unit shipped with a 1 TB Micron 2300 NVMe SSD in the standard M.2 2280 form factor. It's rated for around 3.3 GB per second reads and 2.7 GB per second writes. It doesn't quite hit those lofty read speed goals here, but still turns in a solid 2.9 GB per second while writing at around the same speed. IO is right around where we expect to see it, as well, and the system feels pretty speedy with this drive inside.
 |
| Speedometer Web Application Benchmark |
| Browser Performance |
|
We use BrowserBench.org's
Speedometer test to gauge our web experiences, which takes a holistic look at web application performance. This test automatically loads and runs several sample web apps from ToDoMVC.com using the most popular web development frameworks around, including React, Angular, Ember.js, and even vanilla JavaScript. This test is a better example of how systems cope with real web applications, as opposed to a pure JavaScript compute test like JetStream. All tests were performed using the latest version of Chrome.
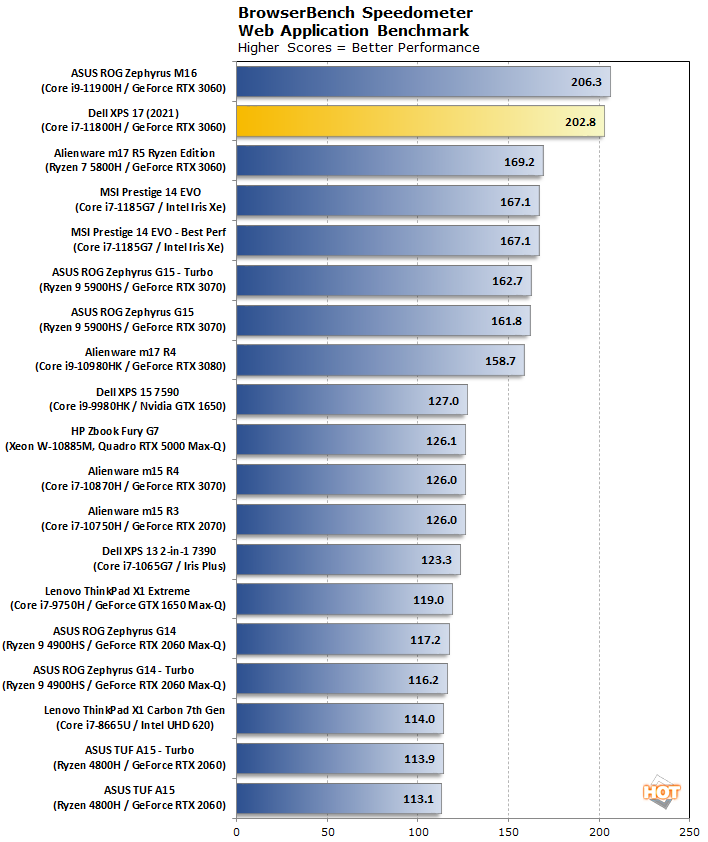
The Core i7-11800H lands the XPS 17 right where we'd expect it -- directly behind the Core i9-11900H-equipped
ASUS ROG Zephyrus M16. 200 runs per minute in Speedometer is excellent, and that definitely translates to standard web browsing. Websites were smooth and speedy in Chrome subjectively, too. We already know that Tiger Lake-H is a powerhouse, and this just cements its single-threaded reputation.
|
|
Cinebench R20 and R23 |
| 3D Rendering Performance |
|
The previous version of Maxon's rendering benchmark,
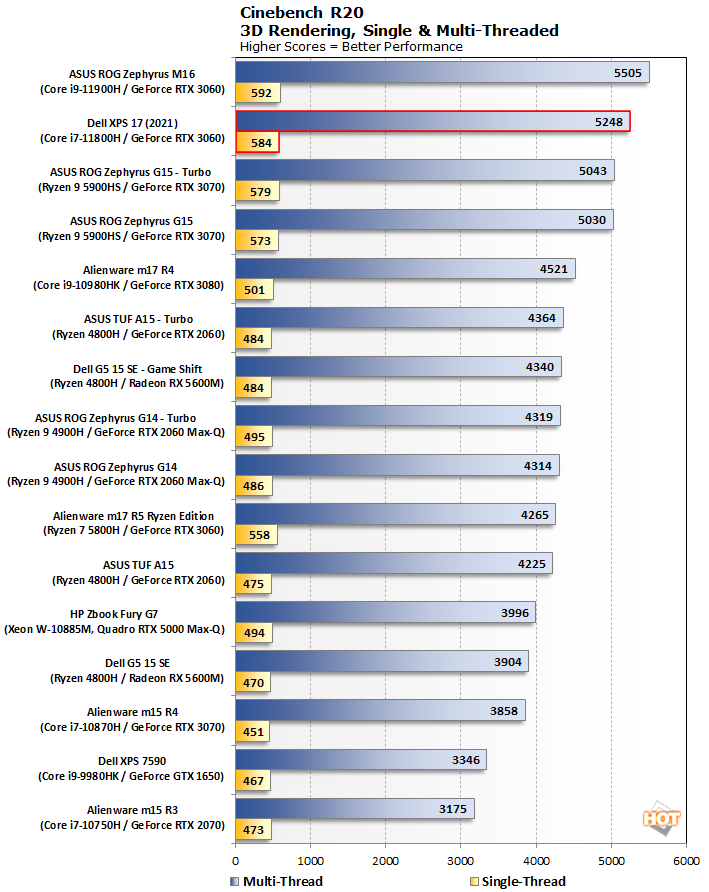
Cinebench R20, takes longer to complete, so this is a better test of a notebook's cooling system. This release also drops the OpenGL test, making Cinebench a pure CPU benchmark this time. We tested both single-threaded and multi-threaded performance here.
Once again, the XPS 17 comes in second to the faster ASUS, but that's not a mark against our review unit. The Core i9-11900H is available as an upgrade, after all, so we'll instead take a moment to appreciate the single-threaded and multi-threaded prowess of this notebook. It also beats out all the Zen 3-powered notebooks like Alienware's m15 R5 Ryzen Edition, which happens to have the same GPU with a higher thermal budget. That doesn't help here, though, as the XPS 17 wins by 5%, and thumps last-gen notebooks like the Intel 10th Gen
Alienware m17 R4.
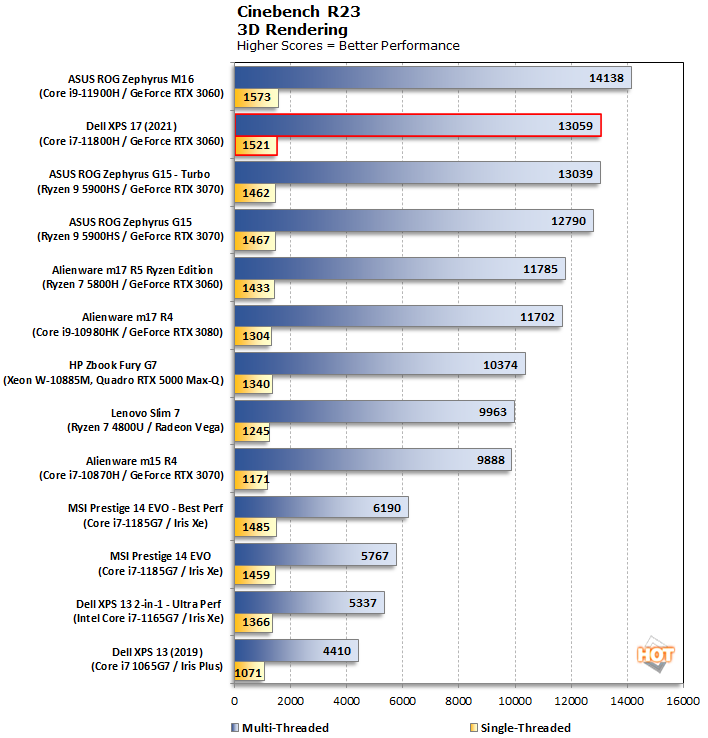
The newest benchmark from Maxon, Cinebench R23, renders the same scene as R20 but with the company's latest rendering engine with support for all current gen hardware.
As we saw in Cinebench R20, the latest version of the benchmark shows the XPS 17 nipping at the M16's heels. Let's take a moment to pour one out for our friends who bought an Alienware m15 R4 back in January after virtual CES 2021, because Intel's latest CPUs put on a spectacular show these days. What a difference just half a year makes.
|
| Geekbench 5 |
|
Single and Multi-Core Performance |
|
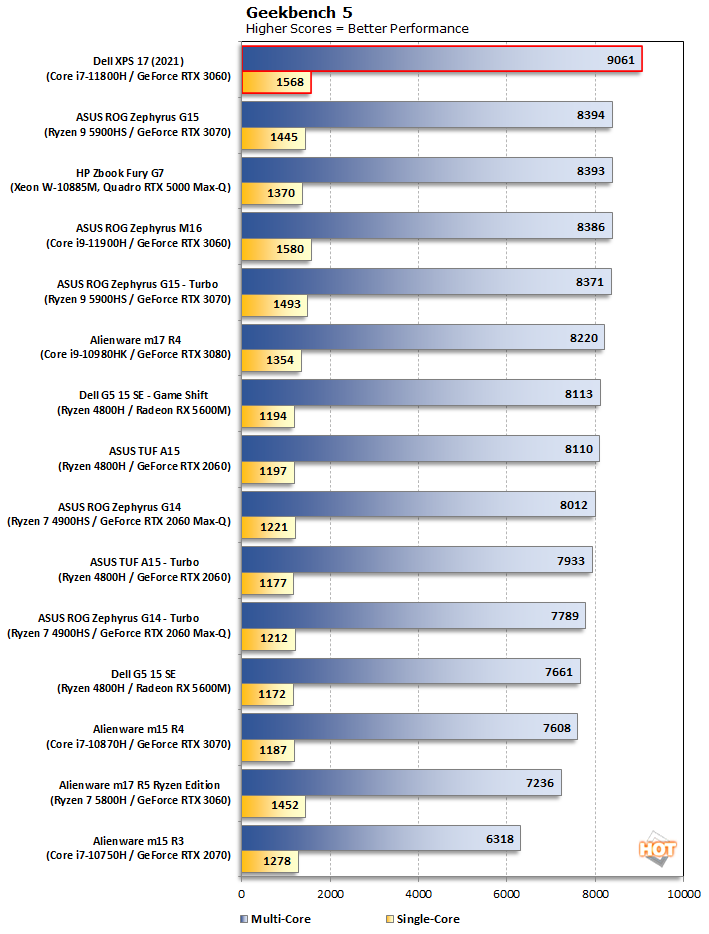
Geekbench is a cross-platform benchmark that simulates real world processing workloads in image processing and particle physics scenarios. We tested the notebooks featured here in Geekbench's single and multi-core workloads. We've retired Geekbench 4 because version 5 performs many of the same tests, which have been updated with the latest CPU architectures and features in mind.
Geekbench is an especially strong spot for the XPS 17. For whatever reason, this Dell machine was able to repeatedly and consistently beat out the M16 to take the top spot in our multi-threaded charts, while also posting excellent single-threaded results. Somehow this notebook beat out the
Core i9-11900H by nearly 10%. Geekbench is a burst-heavy synthetic benchmark, so it's just possible that Dell lets the processor burst a little longer than the rest.
|
| PCMark 10 |
|
Productivity and System-level Benchmarking |
|
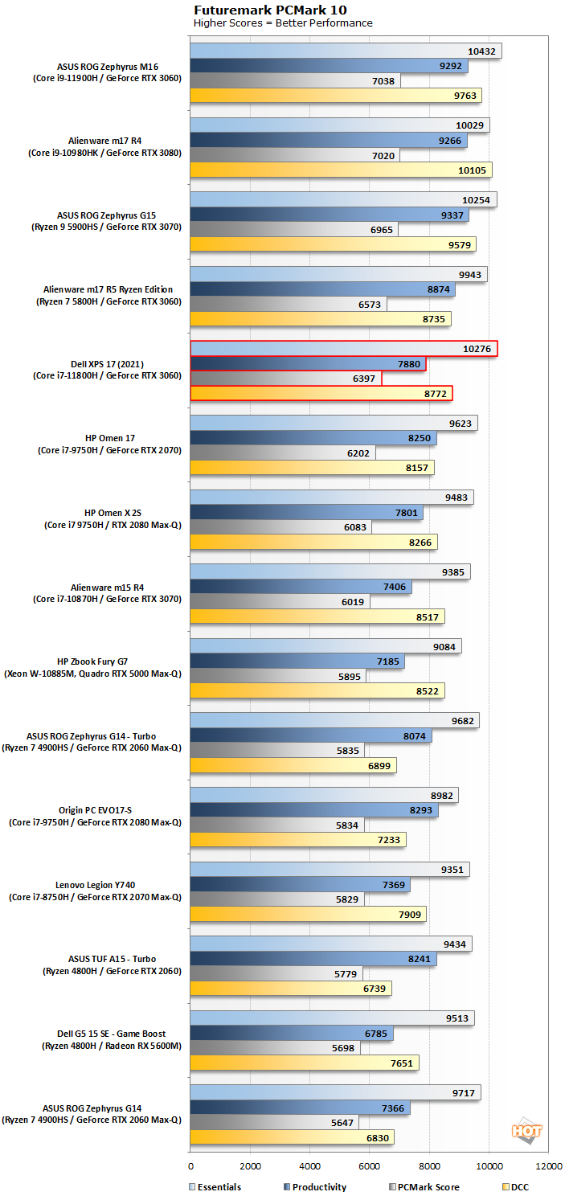
PCMark 10 uses a mix of real-world applications and simulated workloads to establish how well a given system performs productivity tasks, including image and video editing, web browsing, and OpenOffice document editing. While these scores appear to be all over the place, the systems are sorted by their overall PCMark score, which is the third (gray) bar in each cluster.
Here we see the tables have turned and the Zephyrus M16 has scored a win by a full 10% in PCMark. ASUS's scores were higher across the board, but especially so in the more GPU-intensive DCC test. The lower thermal budget in the XPS 17 could be impacting this productivity benchmark. It's not like the XPS 17 scored badly or anything, the ASUS and a couple of Alienware machines like the
Ryzen-powered m15 R5 were just a bit faster.
Now it's finally time to get down with some 3D graphics and gaming tests.
|
| 3DMark Benchmarks |
| 3D Performance |
|
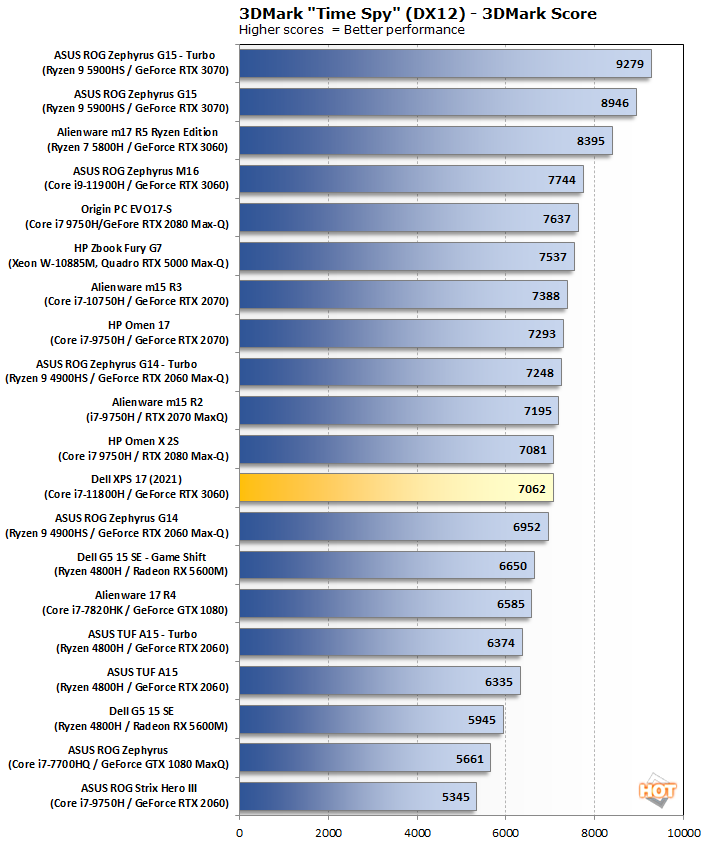
3DMark has several different graphics tests which focus on different types of systems. We start with Time Spy, which is 3DMark's headline benchmark. This test presents a pretty significant challenge for the system's CPU and GPU using DirectX 12's API...
The GeForce RTX 3060 and its slim 70 W TGP make a big impression, but it's not the best for the XPS 17's place rankings. It's definitely in the bottom half, but a series of notebooks with last-gen
GeForce RTX 2080 and 2070 GPUs are essentially tied. The higher thermal budget in the Alienware m15 R5 Ryzen Edition gives it a sizeable advantage on the order of 19 percentage points, however. This isn't a gaming notebook first and foremost. It's as thin and light as it can be while still holding a 17" display, and bearing that in mind, performance is good.
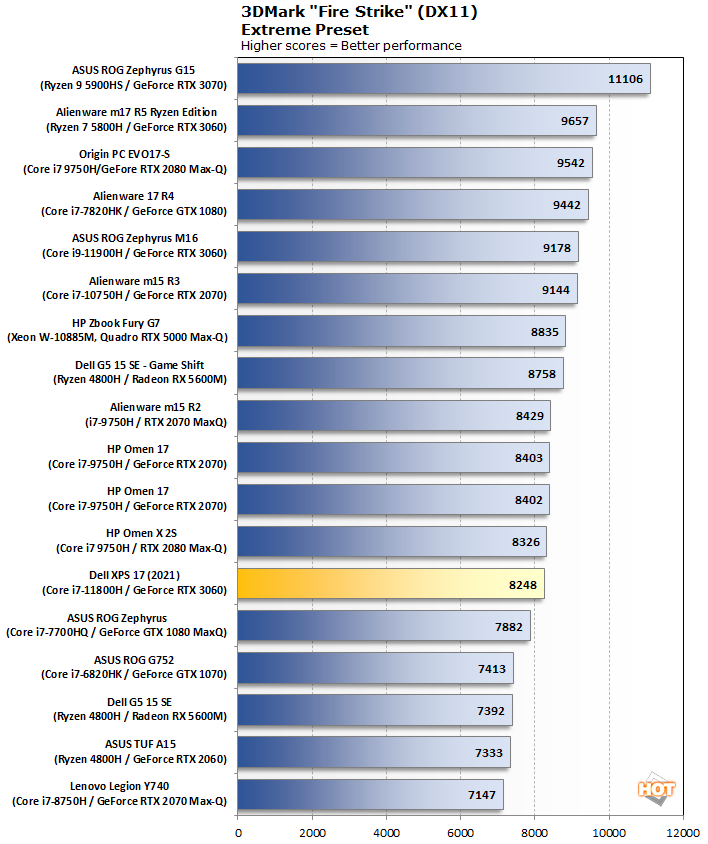
Next up, let's take a look at the Extreme preset for the punishing 3DMark Fire Strike test. This DirectX 11 test has been around for a while, but it's still pretty challenging.
Here in Fire Strike, the same basic trend applies to the XPS 17's somewhat lackluster placement. And just like before, several Turing GPUs that are a step or two up the ladder basically tie, while the Ryzen Edition gets the most out of its GPU. Again, performance is solid and nothing to worry about. If big-screen portability is paramount, performance is perfectly good here.
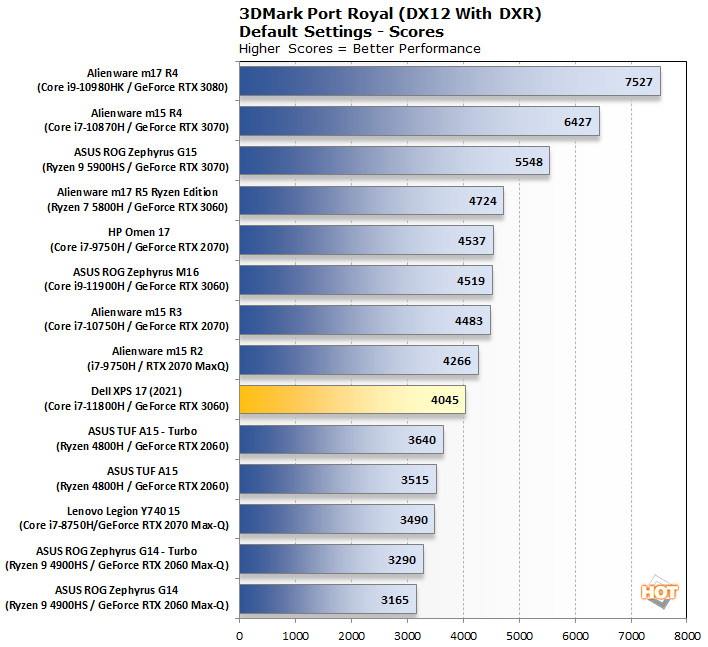
Lastly, the Port Royal test uses DirectX
Ray Tracing (DXR) to illuminate a scene...
This test only works with GPUs that have DirectX Ray Tracing hardware, so there are fewer results. Despite that, Port Royal tells basically the same story as the others. Performance is a big step up over any last-gen GeForce RTX 2060, and right in line with higher-cost SKUs of days gone by.
|
| Far Cry 5 |
| Gaming Performance |
|
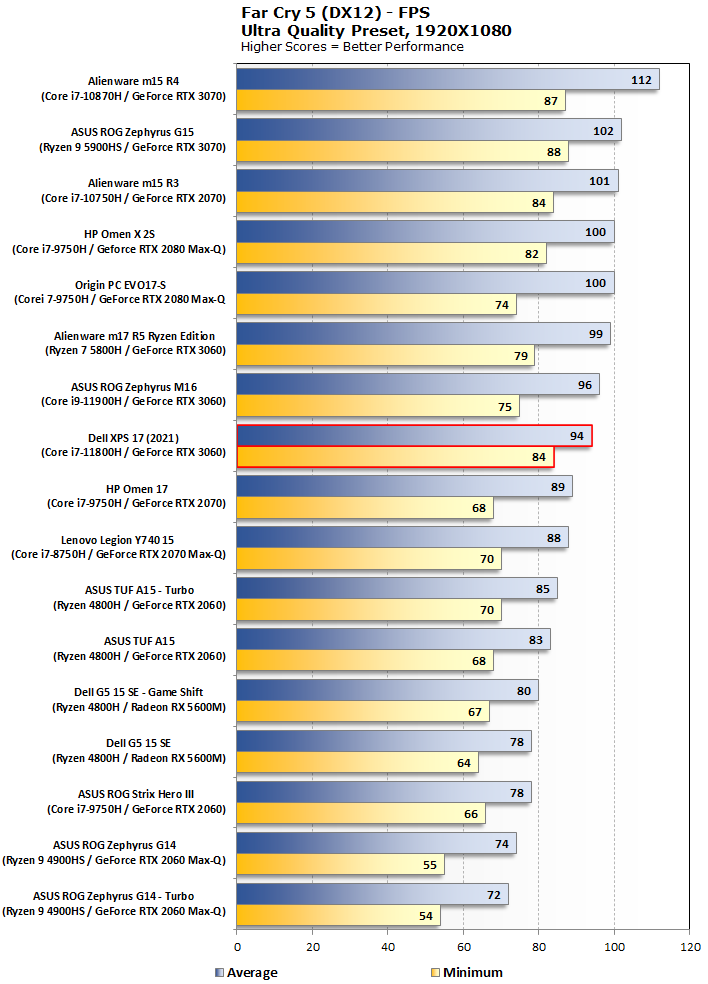
Far Cry 5 takes the franchise to Montana with lush environments and incredible graphics fidelity. We ran this laptop through the built-in benchmarks with Ultra Quality settings.
Moving into actual games this time, it's plain to see why we said there was nothing to worry about in the 3DMark tests. The XPS 17 hits up over 90 fps in this test, which is very smooth. We turned on
Intel's "Retro Scaling" option in the Command Center -- necessary in order for any laptop to turn off discrete graphics when it's not needed -- and played with integer-scaled 1080p pixels and it looked great. This system is not likely to drive modern titles at the full UHD+ resolution, but there's no reason to accept the blur caused by stepping down the resolution if you don't have to.
Oddly enough, there's very little separation between the XPS 17 and the Alienware m15 Ryzen Edition's 125W GPU. Let's see if this trend holds.
|
| Gears 5 |
| Gaming Performance |
|
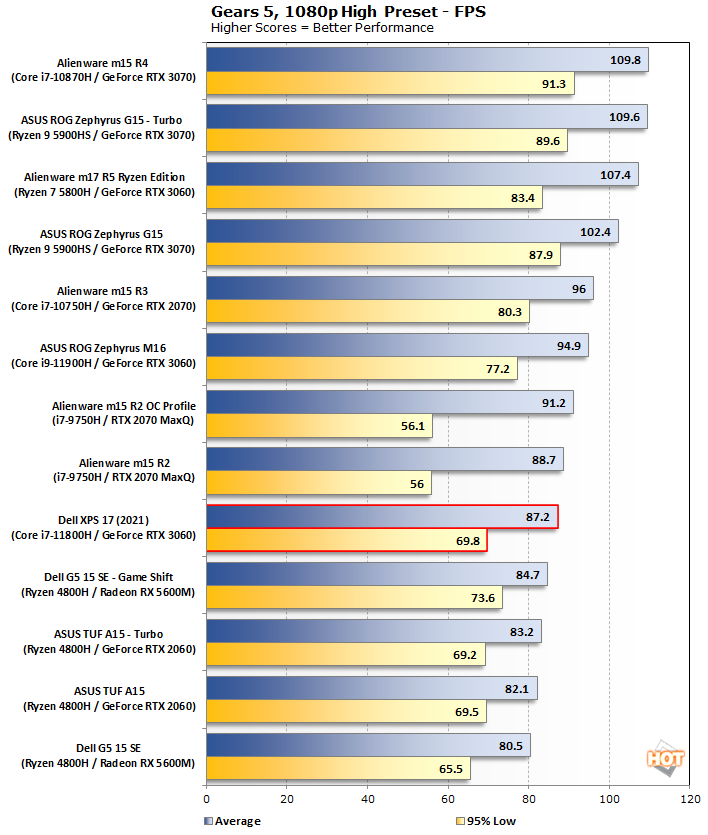
Gears 5 is a tremendously popular title on the Xbox and PC alike, and on top of looking great, it's a blast to play. Due to the relative newness of the game, we don't have a ton of notebooks represented, so we intermingled some desktop GPU results for reference. We used the High preset at 1920x1080, same as before, to test this game.
In
Gears 5, we see more really great performance from the XPS 17. The margin between it and the Alienware m15 R5 Ryzen Edition is pretty steep thanks to the bigger thermal budget in the AMD-equipped laptop, though. The loss is more than 20%, though that machine doesn't have a big 17" 16:10 display yet still has around the same footprint. Again, considering the thermal and size constraints Dell is working with, performance is more than fine.
|
| Middle Earth: Shadow of War |
| Gaming Performance |
|
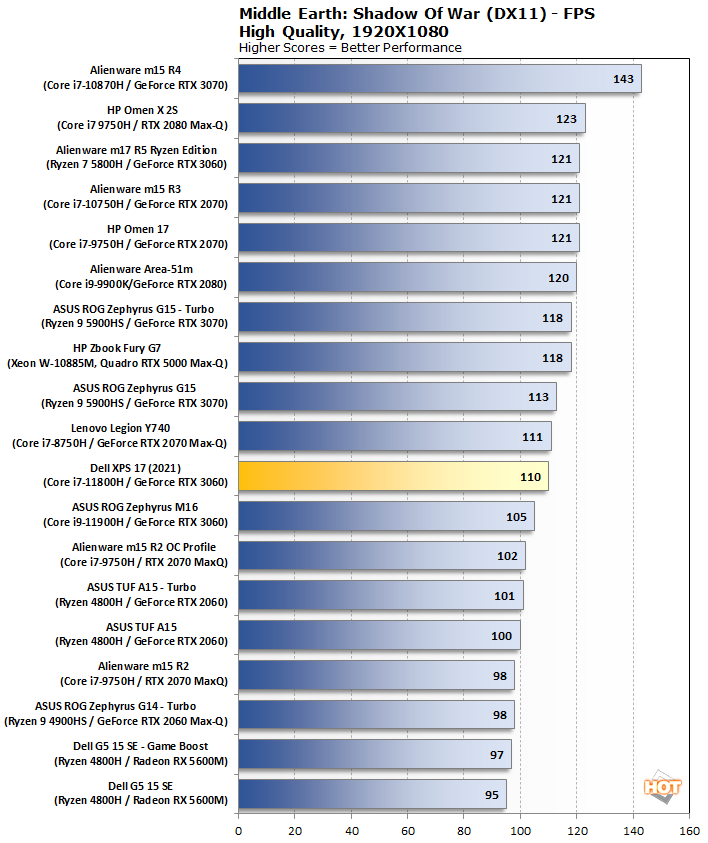
Middle Earth: Shadow of War is a fun and and beautiful title set in Tolkien's Lord of the Rings universe. To test the game's performance relative to other systems, we set the resolution to 1920x1080 and turned the visuals up to the High preset. The frame rates here are the average reported by the built-in benchmark.
Shadow of War is another game that seems to be limited by something other than the graphics card. The Ryzen version of the Alienware is again just a few frames per second ahead of the XPS 17 despite what should be a pretty significant handicap. Whatever the cause, the performance here is quite good.
|
| Shadow of the Tomb Raider |
| Gaming Performance |
|
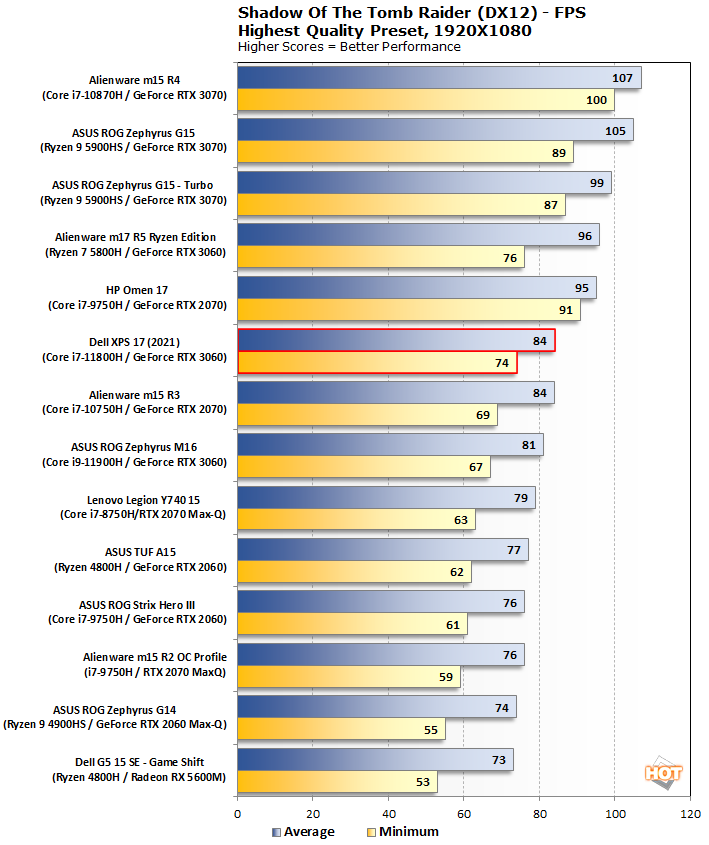
The finale in the rebooted
Tomb Raider trilogy, Shadow of the Tomb Raider is easily the best-looking of the bunch. It's also brimming with Tobii eye-tracking hardware support, and leading edge graphics technologies. To test this game out, we again turned the visuals up to High and tested at the Full-HD resolution of 1920x1080.
The final Tomb Raider game (and our last 3D test, incidentally) shows comparisons that are quite different than the other games in our suite. The Alienware wins by a bit more than 11%, which is measurable but not especially huge like Gears 5. It's also ahead of the ASUS Zephyrus ROG M16 despite that system's bigger thermal budget. You may recall that the M16 ran quite hot, however, so it could just be that it was throttled back a bit where the XPS 17 is not. At any rate, every game we tested had average FPS in the mid-80s or higher at 1080p. We think travelers who are doing other work but gaming on the side will find this a solid option.
|
| Battery Performance |
|
Gaming and Video Playback Performance |
|
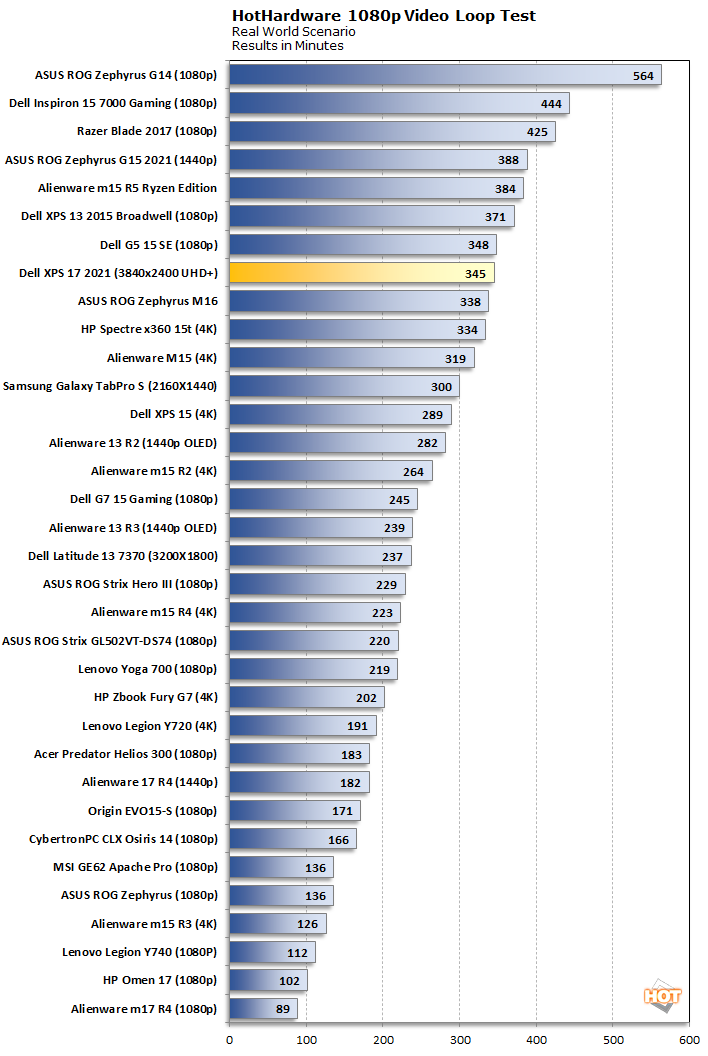
We run a custom 1080p HD video loop test developed in-house, to prove out battery life with our test group of machines. In all tests, Windows 10 Quiet Hours has been enabled and the displays are calibrated with lux meters on pure white screens to as close to 115 lux as possible. For the average laptop this is somewhere between a 40-60 percent brightness setting.
Battery life here is pretty solid. 97 Wh is about as big as the FAA will allow on planes, so there's not much room for improvement. The XPS 17 has a big honkin' display with a backlight to keep bright, so the fact it could push all the way up to nearly six hours of battery runtime is impressive, especially when considering the UHD+ resolution. We were honestly blown away by the battery life, even if it isn't the top of the charts. This system is faster than most of the longer-lasting notebooks here, save for the Alienware m15 R5 and
ROG Zephyrus G15, so there's a great balance of speed and longevity.
Let's head on to the teardown, where we can see how the M16 keeps everything cooled.