HP Omen Transcend 16 Gaming Laptop Review: Balanced & Beautiful
HP Omen Transcend 16: System Performance, Gaming And Graphics Benchmarks
The custom Omen Transcend 16 configuration at Best Buy comes with Windows 11 Home installed (you can select Windows 11 Pro if configuring through HP's website). Prior to testing, I removed McAfee from the system, updated Windows, applied the latest BIOS available, and installed the newest drivers where applicable.
ATTO Disk Benchmark
The ATTO disk benchmark is a fairly quick and dirty test that measures sequential read/write bandwidth across a range of different data sizes. While we don't typically compare these results across multiple machines, it's useful to gauge whether a particular notebook's storage subsystem is up to snuff for the use case scenarios that the machine will be tasked with handling.
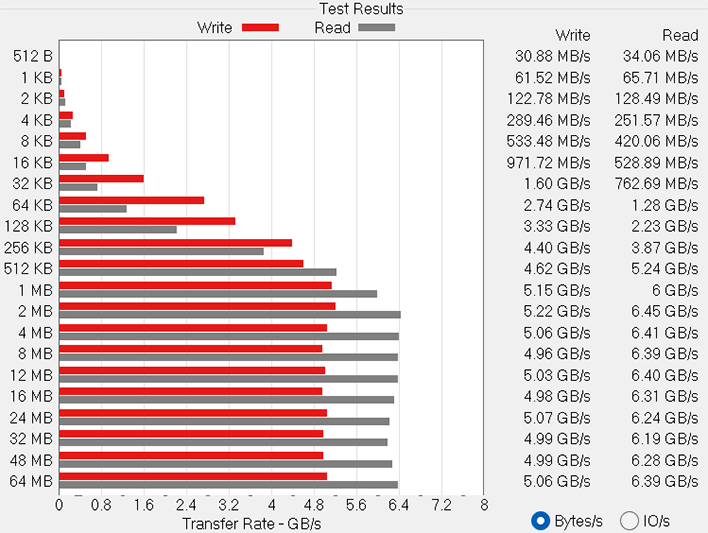
As configured, the Omen Transcend 16 is sitting pretty with a 1TB Kioxia XG8 series SSD. This is a single-sided PCIe 4.0 drive with 112-layer 3D triple-level cell (TLC) BiCS Flash memory and SLC write cache. The specs are the same as the 2TB model we reviewed in 2022—it's rated to deliver up to 7,000MB/s of sequential read performance and up to 5,600MB/s for sequential writes.
The drive came close to those speeds in our ATTO testing. As shown above (screen shot incoming), it topped out at 6.45GB/s (6,450MB/s) for sequential reads and 5.22GB/s (5,220MB/s) for sequential writes. This is a fast SSD, and also upgradeable if you ever find yourself running low on disk space.
Speedometer 2.0 Browser Benchmark
We use BrowserBench.org's Speedometer test to gauge our web experiences, which takes a holistic look at web application performance. This test automatically loads and runs several sample web apps from ToDoMVC.com using the most popular web development frameworks around, including React, Angular, Ember.js, and even vanilla JavaScript. This test is a better example of how systems cope with real web applications, as opposed to a pure JavaScript compute test like JetStream. All tests were performed using the latest version of Chrome.
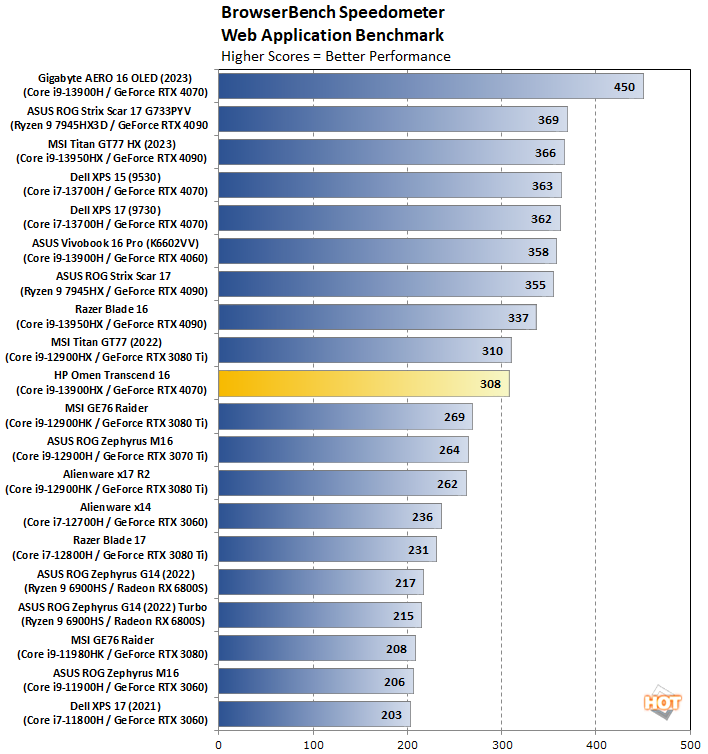
Today's laptops don't break much of a sweat in this app, and that's the case for the Omen Transcend 16, though it didn't race to the top of the chart. It did, however, break the 300 threshold with a score of 308, which is right on the heels of the MSI Titan GT77 (Core i9-12900HK) and not terribly far behind the Razer Blade 16 (Core i5-13950HX).
Cinebench R23 Rendering Benchmark
This is the latest 3D rendering benchmark from Maxon, based on the Cinema 4D R23 rendering engine. We tested both single-threaded and multi-threaded tests on all of the notebooks represented here...
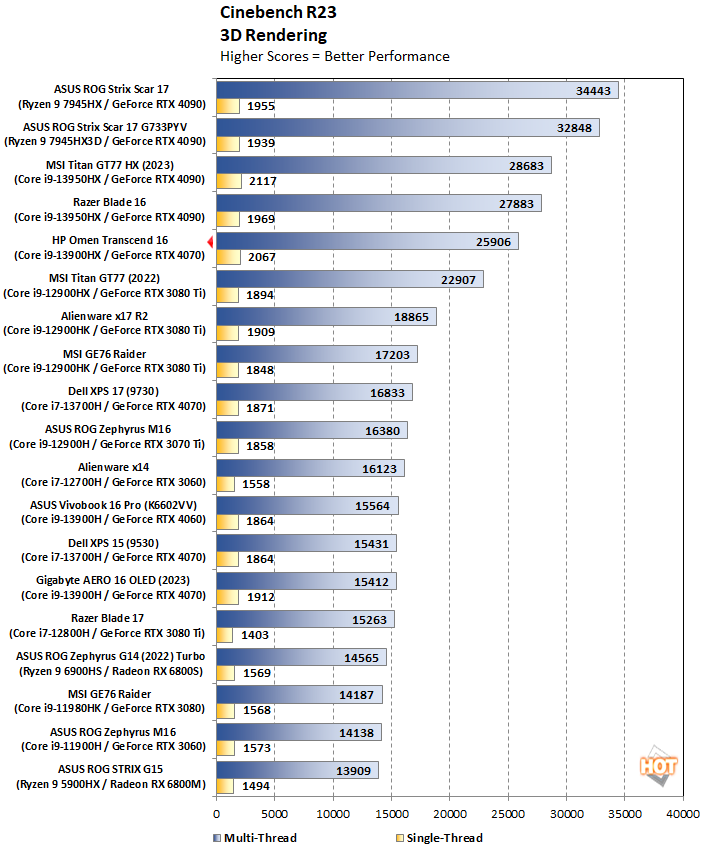
The Omen Transcend 16 improved its positioning a bit when hammering the CPU with Cinebench R23. Armed with a Core i9-13900HX processor, the laptop finished with the second-highest single-core score at 2,067, trailing just the MSI Titan GT77 HX with a faster Core i9-13950HX, and settled into the upper-quadrant with a multi-core score of 25,906. These are great scores for a laptop, especially one that is relatively thin and light.
Geekbench 5 Benchmarks
Geekbench is a cross-platform benchmark that simulates real world processing workloads in image processing and particle physics scenarios. We tested the notebooks featured here in Geekbench's single and multi-core workloads. It measures single-threaded performance allowing a single core to stretch its legs, and multi-threaded throughput to put all cores under a heavy load.
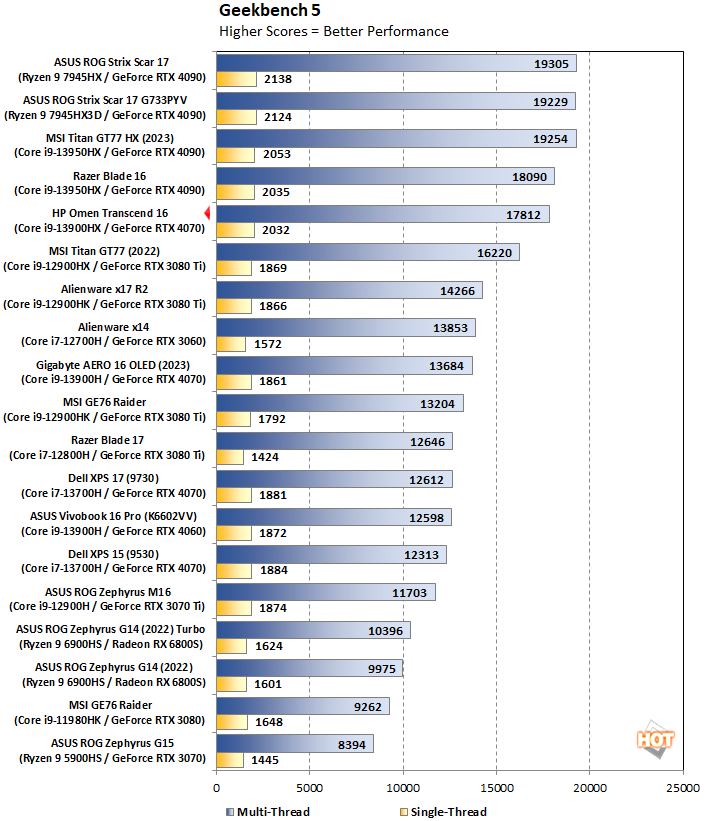
The Omen Transcend 16 again climbed into the upper echelon of scores in Geekbench 5, posting a 2,032 single-core score and 17,812 multi-core score. Both of those are well ahead of the similarly equipped Gigabyte Aero 16 OLED, which features the same CPU and GPU.
PCMark 10 Whole System Benchmarks
PCMark 10 uses a mix of real-world applications and simulated workloads to establish how well a given system performs productivity tasks, including image and video editing, web browsing, and OpenOffice document editing. While these scores appear to be all over the place, the systems are sorted by their overall PCMark score, which is the third (gray) bar in each cluster.
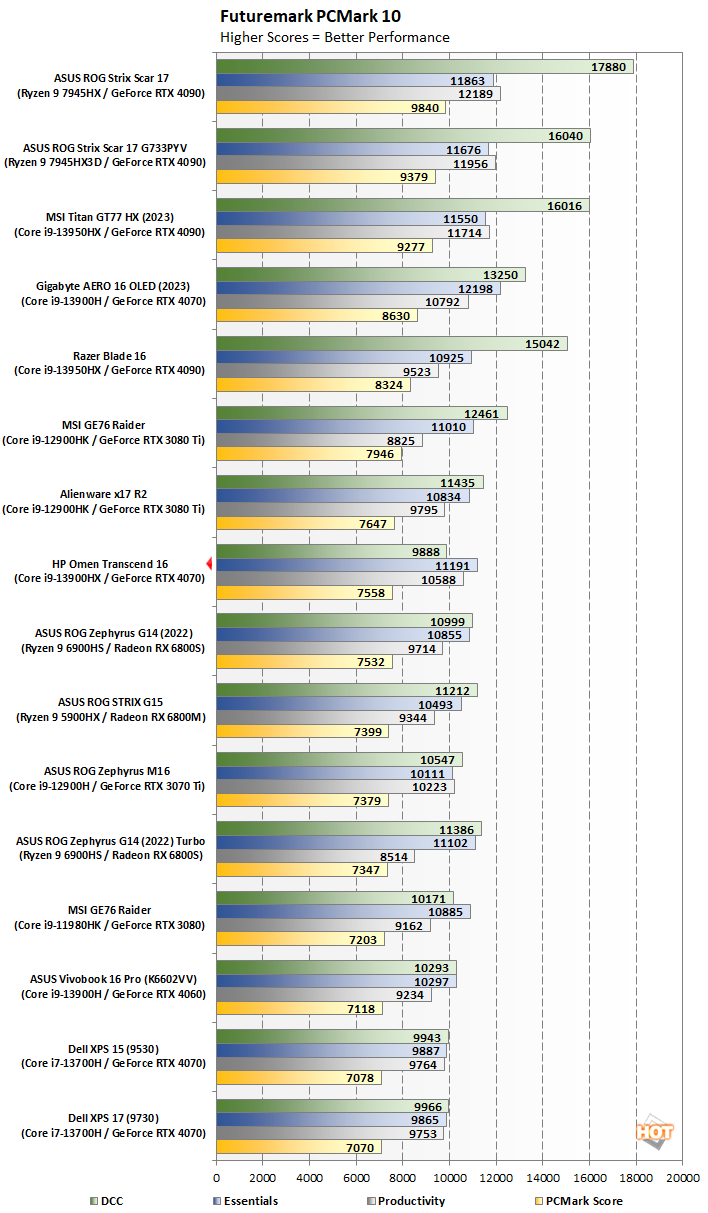
The HP Omen Transcend 16 fell a few pegs in PCMark 10 when sorting by the overall score, which came to 7,558. Interestingly enough, it was held back the lowest Digital Content Creation score of all laptops in our comparison graph. Otherwise, it performed as expected in the remaining tests, so perhaps this was a benchmark anomaly.
3DMark Graphics And GPU Tests
3DMark has several different graphics tests which focus on different types of systems. We start with Time Spy, which was 3DMark's headline benchmark until just recently. This test presents a pretty significant challenge for the system's CPU and GPU using the DirectX 12 API...
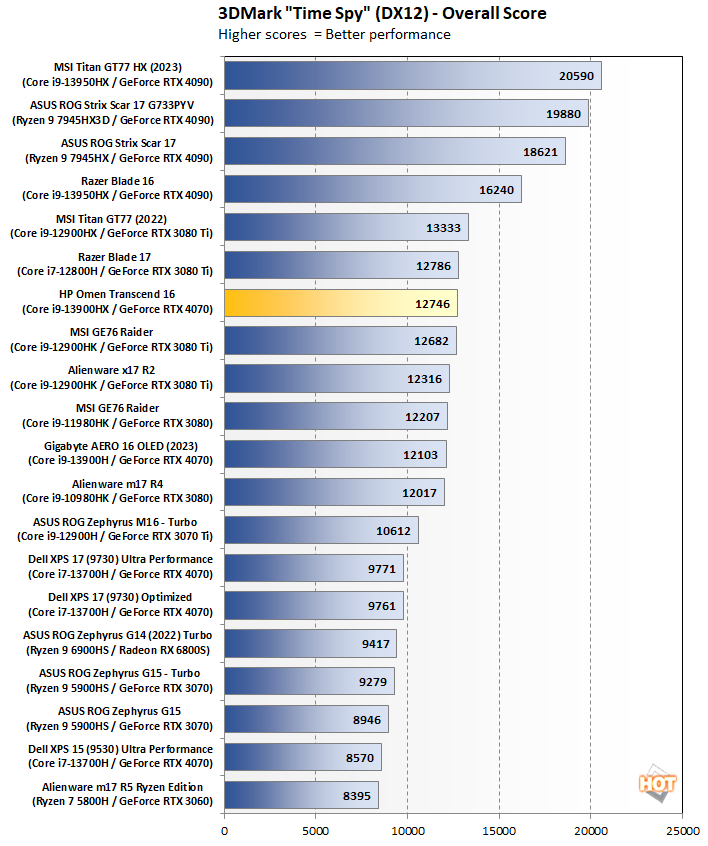
Switching the attention to the graphics-heavy 3DMark suite, the Omen Transcend 16 with its GeForce RTX 4070 scored 12,746 in the Time Spy test based on DirectX 12. That's a great showing—it better than 5% faster than the Gigabyte AERO 16 OLED with the same GPU, and it puts the laptop right in the mix of other gaming systems with a mobile GeForce RTX 3080 Ti.
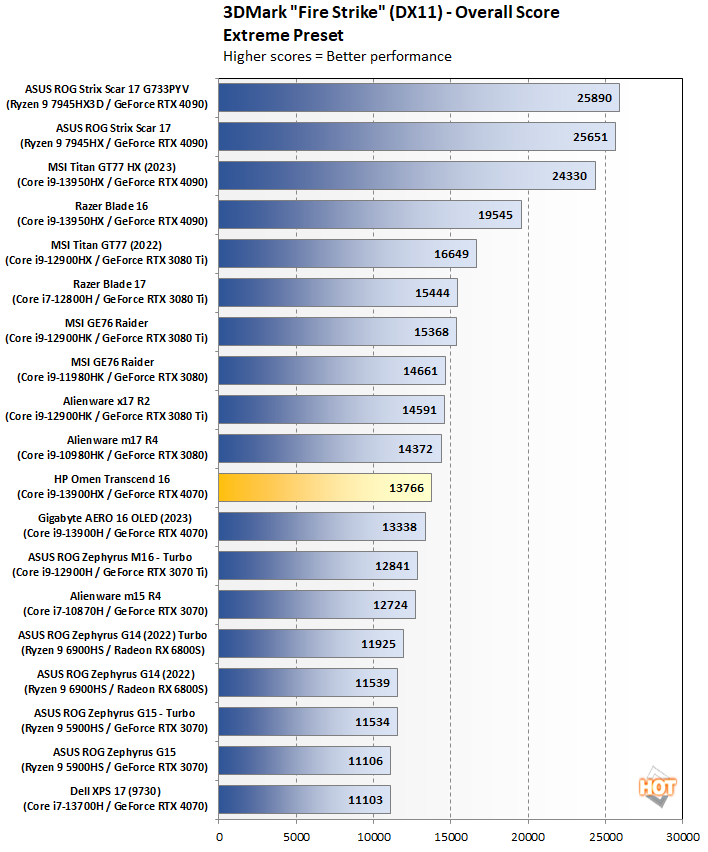
At a rushed glance, the Omen Transcend 16 falls into the middle of the pack in the 3DMark Fire Strike Extreme test based on DirectX 11. But look closer and you'll see it finished right where it should, for the most part. Once again, it managed to outpace the Gigabyte AERO 16 OLED while approaching GeForce RTX 3080 Ti territory.
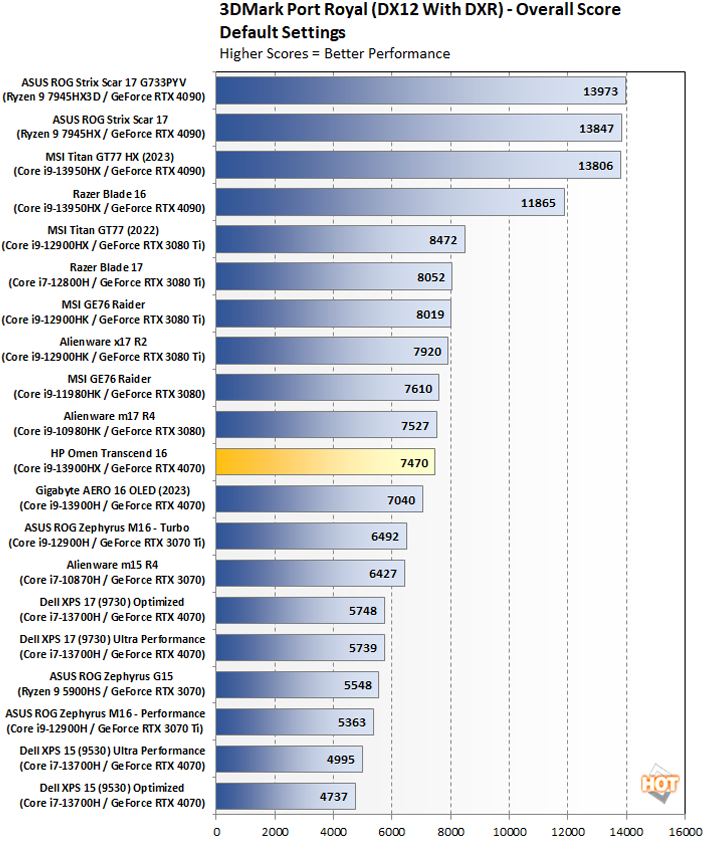
Once again, the Omen Transcend 16 zips in front of the Gigabyte AERO 16 OLED with a score of 7,460 in the Port Royal benchmark. It also beat out the Dell XPS 17 (9730), which is another laptop with a GeForce RTX 4070 GPU inside.
Now let's look at some actual games...
Middle Earth: Shadow Of War Tests
Middle Earth: Shadow of War is a fun and beautiful title set in Tolkien's Lord of the Rings universe. To test the game's performance relative to other systems, we set the resolution to 1,920 x 1,080 (or 2,560 x 1,440) and turned the visuals up to the High preset. The frame rates here are the average reported by the built-in benchmark.
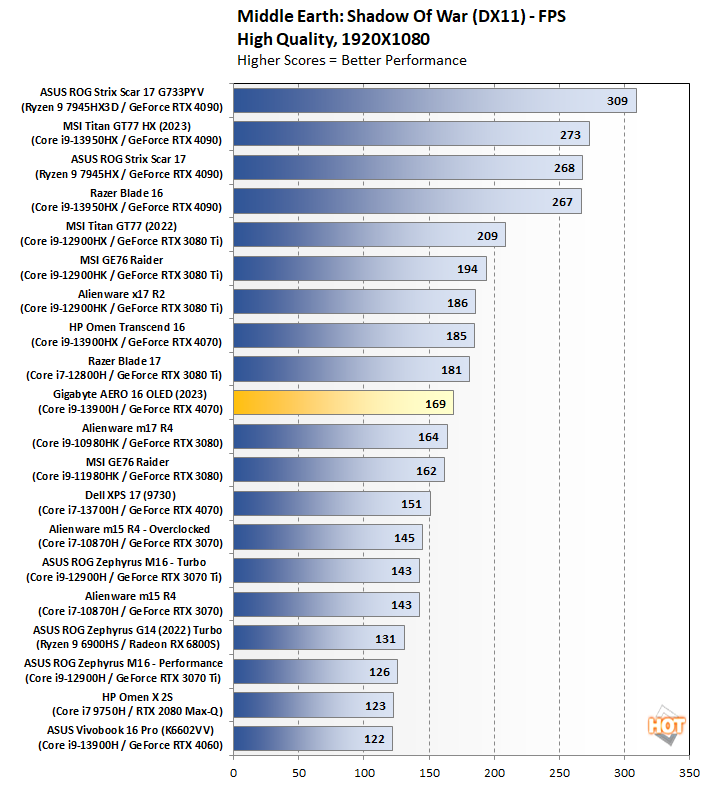
At 1080p with the graphics set to High, the Omen Transcend 16 averaged 185 frames per second in Middle Earth: Shadow of War. That puts it ahead of other laptops equipped with the same GPU and in the company of systems configured with a GeForce RTX 3080 Ti like last year's Alienware x17 R2, which it trailed by a single FPS.
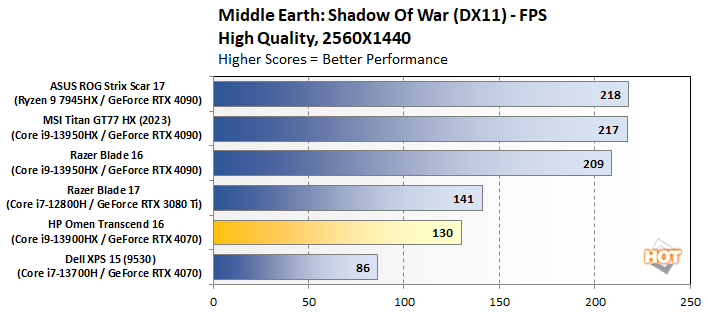
We have less scores to compare against at 1440p. This graph will paint a more accurate picture over time as it gets fleshed out, but for now, the last place finish is not concerning—the Omen Transcend 16 managed 130 FPS, compared to 141 FPS for Razer's Blade 17 with a GeForce RTX 3080 Ti and over 200 FPS for laptops with NVIDIA's flagship GeForce RTX 4090.
Shadow Of The Tomb Raider Benchmarks
The finale in the rebooted Tomb Raider trilogy, Shadow of the Tomb Raider is easily the best-looking of the bunch. It's also brimming with Tobii eye-tracking hardware support, and leading-edge graphics technologies. To test this game out, we again turned the visuals up to their highest preset and tested at the FullHD resolution of 1920x1080, and again at 2560x1440.
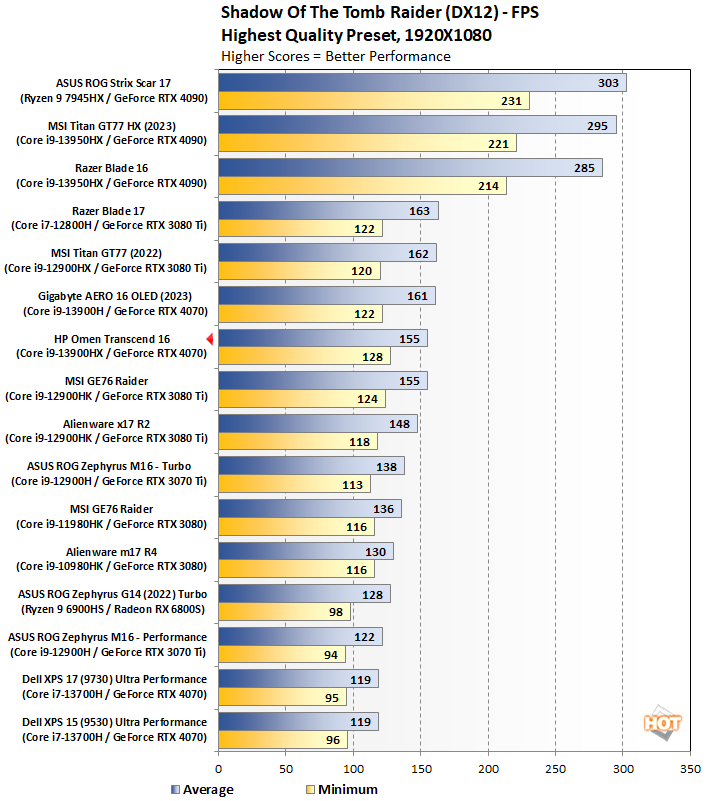
In Shadow of the Tomb Raider, the Omen Transcend 16 slid behind Gigabyte's AERO 16 OLED though just by 5 FPS. Both laptops were able to average north of 150 FPS at 1080p at the highest graphics settings. And once again, that puts it the same neighborhood as laptops with a 3080 Ti.
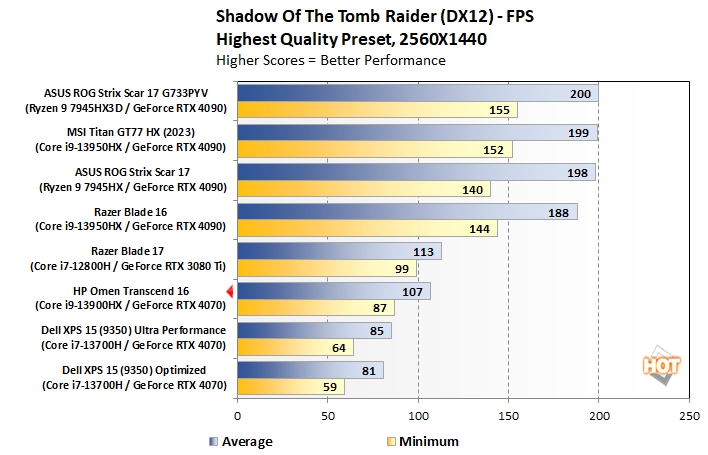
Impressively, this laptop's GeForce RTX 4070 still managed to keep framerates in the triple digits after bumping up the resolution to 2560x1440. That's a credit to HP configured the GPU at 130W (115W + 15W via Dynamic Boost) with a 2,175MHz boost clock. By comparison, the GeForce RTX 4070 inside the productivity-oriented Dell XPS 15 9530 is configured for a 40W profile to prioritize heat management and battery life, hence why the Omen Transcend 16 ran up to 32.1% faster in this benchmark.
F1 2021 Benchmarks
F1 2021 supports DirectX 12 with ray tracing, and it incorporates support for a number of AMD's FidelityFX Super Resolution (FSR) and NVIDIA technologies (like DLSS). We tested the game with its Ultra High graphics preset, with ray-tracing and TAA enabled at a couple of resolutions.
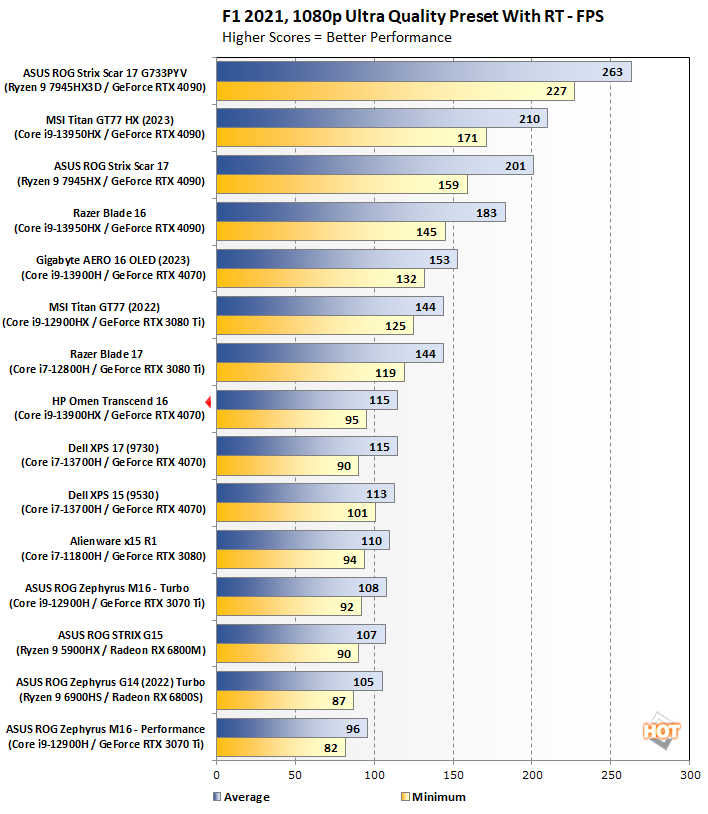
The Omen Transcend 16 was able to hit triple-digit framerates again, though this time it couldn't create much separation between it and the Dell XPS 15 9530. It also trailed noticeably behind laptops with a GeForce RTX 3080 Ti. It's possible that F1 2021 managed to push the cooling constraints of this laptop, resulting in a lower-than-expected (albeit still very much playable) average framerate.
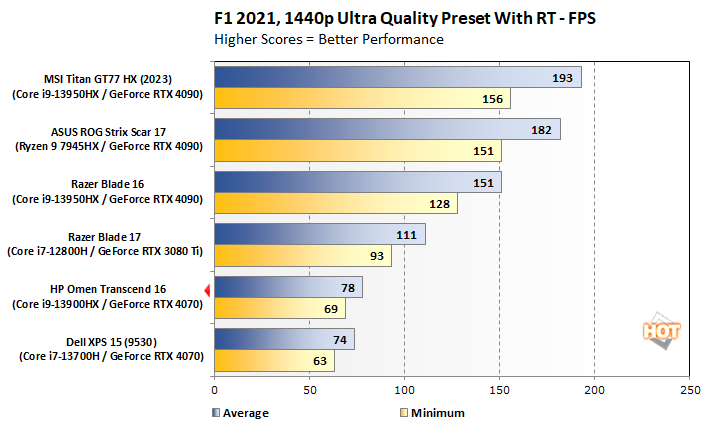
The same story played out when increasing the resolution to 1440p. That said, the Omen Transcend 16 still performed above 60 FPS with a comfortable cushion for framerate dips.
Marvel's Guardians Of The Galaxy
Marvel’s Guardians of the Galaxy is an action-adventure game where you play as Star-Lord and lead the rest of the Guardians from mission to mission. The game’s minimum requirements call for a Radeon RX 570 or GeForce GTX 1060-class GPU, but it also supports some of the latest graphics technologies, including ray tracing and DLSS.
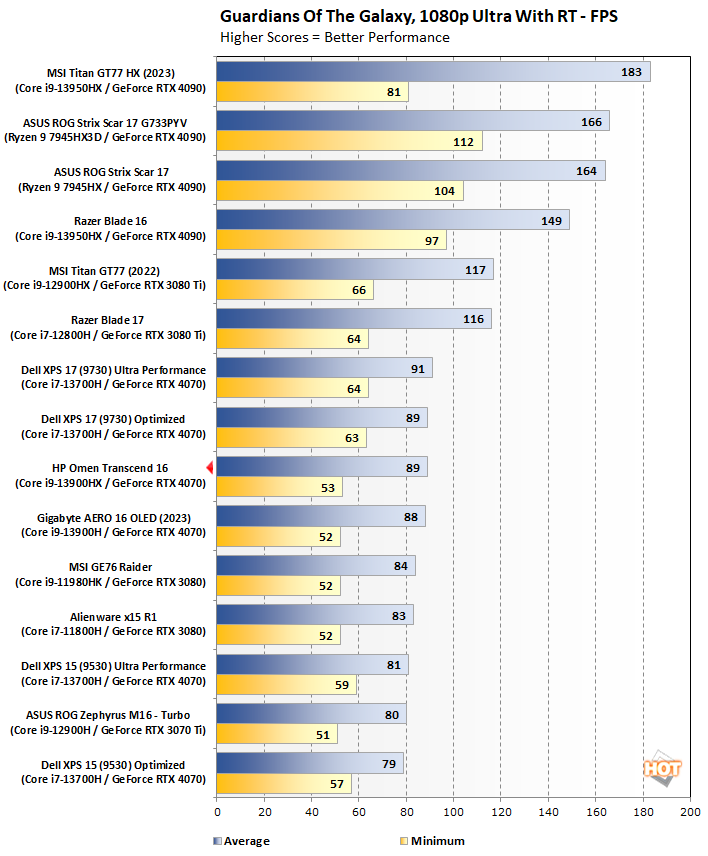
At 1080p and with ray tracing enabled, HP's Ceramic White laptop was knocking at the door of 90 FPS. Performance between it, Dell's XPS 17 9730 (not to be confused with the XPS 15 9530), and Gigabyte's AERO 16 OLED was virtually the same in this benchmark.
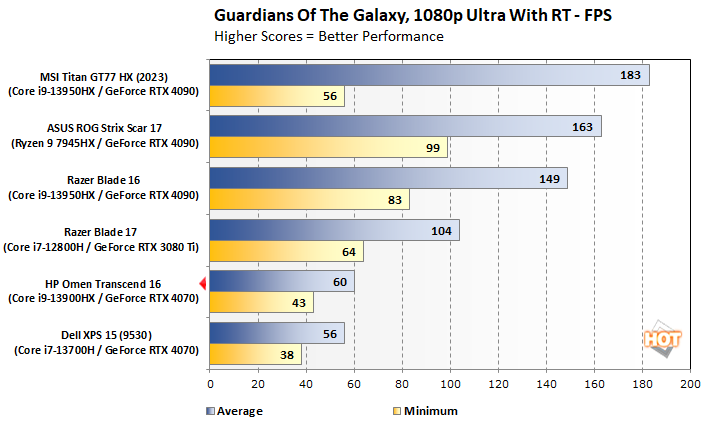
After bumping up the resolution to 1440p, the Omen Transcend 16 saw a dip in framerates but still was able to hit 60 FPS on average, and it sneaked past Dell's XPS 15 with the same GPU on board but a lower-end Intel Core processor. Gotta love those higher mins as well.
All told, the HP Omen Transcend 16 proved capable of gaming at high settings, both with and without ray tracing enabled. Now let's have a look at its internal layout, cooling, and battery life...


