Intel SSD DC P4600 NVMe PCIe Review: Low-Latency TLC Storage For The Data Center
Intel SSD DC P4600 - Test Setup, IOMeter, And Compression Tests
Our Test Methods: Under each test condition, the SSDs tested here were installed as secondary volumes in our testbed, with a separate drive used for the OS and benchmark installations. Out testbed's motherboard was updated with the latest BIOS available at the time of publication and AHCI mode was enabled for the host drive.
The SSDs were secure erased prior to testing (when applicable), and left blank without partitions for some tests, while others required them to be partitioned and formatted, as is the case with the ATTO, PCMark, and CrystalDiskMark benchmark tests. Windows firewall, automatic updates, and screen savers were all disabled before testing and Windows 10 Quiet Hours were enabled. In all test runs, we rebooted the system, ensured all temp and prefetch data was purged, waited several minutes for drive activity to settle and for the system to reach an idle state before invoking a test. Also note that all of the drives features here were tested with their own drivers installed -- not the default Windows 10 NVMe driver.
|
| Processor - Motherboard - Video Card - Memory - Audio - Storage - |
Intel Core i7-8700K Gigabyte Z370 Ultra Gaming (Z370 Chipset, AHCI Enabled) Intel HD 630 16GB G.SKILL DDR4-2666 Integrated on board Corsair Force GT (OS Drive) Intel Optane SSD 900p (280GB) Inte SSD 750 (480GB) Samsung SSD 960 Pro (1TB) Micron 9100 MAX (2.4TB) Intel SSD DC P3700 (800GB) Intel SSD DC P4600 (2TB) |
OS - Chipset Drivers - DirectX - Benchmarks - |
Windows 10 Pro x64 Intel 10.1.1.44, iRST 15.8.1.1007 DirectX 12 IOMeter 1.1 HD Tune v5.70 ATTO v3.05 AS SSD CrystalDiskMark v6.0.0 x64 PCMark Storage Bench 2.0 SiSoftware SANDRA |
|
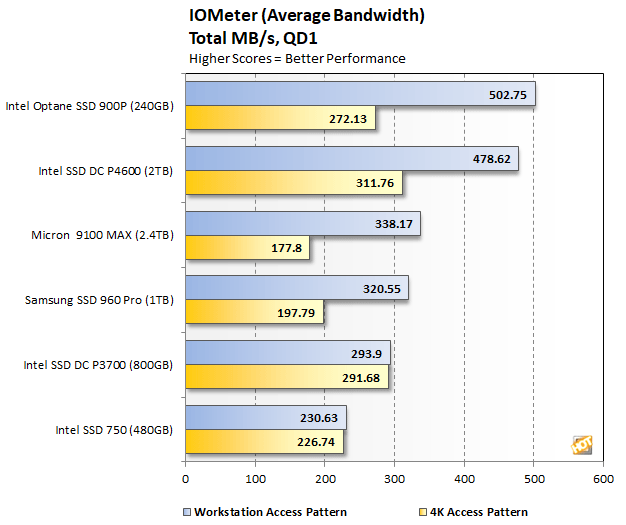
In the following tables, we're showing two sets of access patterns; a custom Workstation pattern, with an 8K transfer size, consisting of 80% reads (20% writes) and 80% random (20% sequential) access and a 4K access pattern with a 4K transfer size, comprised of 67% reads (33% writes) and 100% random access. Queue depths from 1 to 32 were tested, though keep in mind, most consumer workloads usually reside at low queue depths...
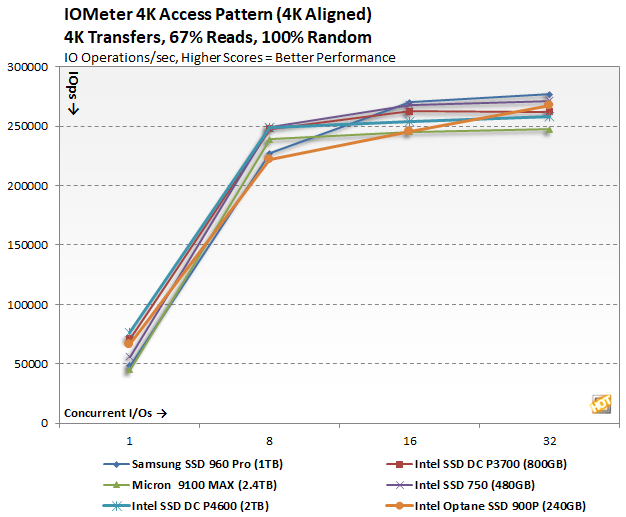

Below QD8 in the 100% random 4K test, the Intel SSD DC P4600 is among the stronger performers in the group. Once the queue depth increases, performance trails a few of the other drives somewhat, but overall they are tightly groups. With the 8K80 access patters that introduces some sequential transfers in the mix, the Intel SSD DC P4600 does a little better and finishes at or near the top at every queue depth.

|


