Samsung SSD 870 QVO Review: Terabytes Of Solid State Storage


Samsung SSD 870 QVO Review: Ultra-High Capacity V-NAND Jam-Packed For SATA Storage

samsung ssd 870 qvo angle
Although much of the excitement in the solid state storage market revolves around the latest, bleeding-edge NVMe-based drives, there is still a massive need for SATA-based solutions. Not only are there a myriad of legacy systems ripe for upgrades that rely on SATA, but owners of current-gen systems often want more affordable, higher-capacity -- but still fast -- solid state storage to pair with their NVMe boot drives. Samsung has traditionally been a leader in the space, with a succession of popular drives over the years. The newest members of the family, the Samsung SSD 870 QVO we’ll be showing you here today, builds upon Samsung’s success with higher capacities, strong performance and what will ultimately be lower cost.

We’ve got a couple of Samsung SSD 870 QVO drives on hand, in 1TB and 2TB capacities. These drives, however, will be offered in capacities as high as 8 Terabytes, which would make for a nice speedy repository for that Steam folder of yours that’s full of games or that massive of collection of RAW images you’ll process someday...
samsung ssd 870 style 2
Samsung SSD 870 QVO
Specifications & Features

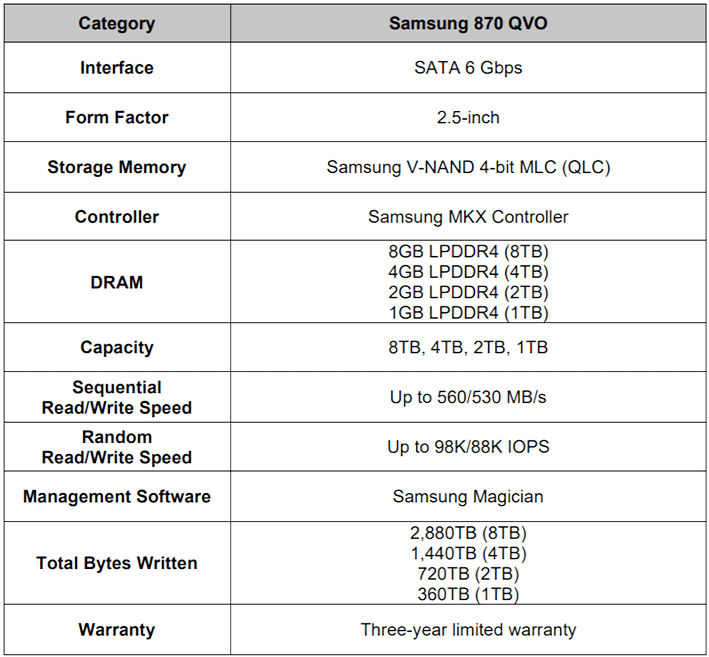
The Samsung SSD 870 QVO series of drives are built around Samsung’s 9x-layer, 4-bit per cell QLC (quad level cell) V-NAND. That NAND is paired to a proprietary Samsung MKX controller and some LPDDR4 DRAM cache. Details are scarce on the controller, but the amount of DRAM installed on each drive is listed right in their specs – there is essentially 1GB of DRAM per 1TB of drive capacity.
samsung ssd 870 qvo bottom
All of the drives in the family are rated for 560MB/s reads with 530MB/s writes, with 98K / 88K read / write random IOPS. Endurance / TBW (total bytes written) is 360X the capacity, so up to 2,880TB on the kingpin 8TB drive. And all of the drives carry a 3-year limited warranty.
samsung ssd 870 qvo top
Externally, Samsung continues with their traditional design aesthetic. The drives are the usual 2.5” 7mm form factor (as you would expect), with the top side of the drives emblazoned with Samsung branding and a colored square. The bottom is home to a decal with all of the particulars, serial number info, etc.

Three pentalobe screws secure the enclosures – one screw is visible and two reside under the decal. Disengage those screws and the enclosures open right up to reveal the PCBs inside.
samsung ssd 870 qvo internal 1
samsung ssd 870 qvo internal 2
What you see pictured here is the internal PCB of the 2TB Samsung SSD 870 QVO. As you can see, the PCB is tiny, and fills only a small portion of the 2.5” enclosure. In total, there are only 4 chips inside – the controller, one piece of DRAM, and two pieces of NAND, plus some surface mounted components.

write cache 870 qvo
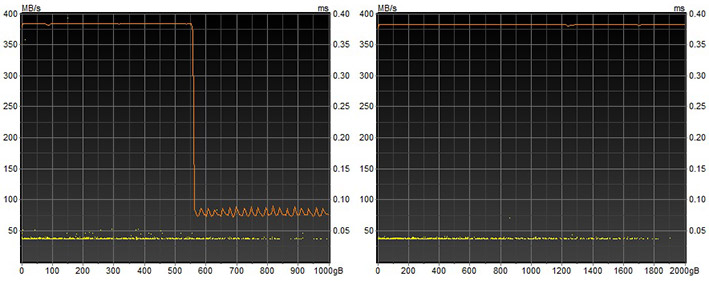
Write Performance, 1TB Drive (Left), 2TB Drive (Right)

A technology incorporated into the SSD 870 QVO recycled from older drives is Intelligent TurboWrite, which uses a portion of the NAND like a variable SLC write buffer. This allows the QLC NAND to perform more like a MLC drive for writes, giving write performance an overall boost. With the 1TB drive, we saw performance drop off at the 550GB mark, but the 2TB drive’s variable buffer is large enough and flushes data fast enough to maintain peak performance across the entire capacity. We should also mention that both drives support Samsung latest data migration tools and Magician SSD utility as well.

Samsung SSD 870 EVO Benchmarks

Under each test condition, the SSDs tested here were installed as secondary volumes in our testbed, with a separate drive used for the OS and benchmark installations. Out testbed's motherboard was updated with the latest BIOS available at the time of publication. The SSDs were secure erased prior to testing (when applicable), and left blank without partitions for some tests, while others required them to be partitioned and formatted, as is the case with the ATTO, PCMark, and CrystalDiskMark tests. Windows firewall, automatic updates, and screen savers were all disabled before testing and Windows 10 Quiet Hours / Focus Assist was enabled.

samsung ssd 870 style 1
In all test runs, we rebooted the system, ensured all temp and prefetch data was purged, waited several minutes for drive activity to settle, and for the system to reach an idle state before invoking a test. Also note, we have completely revamped our test bed, so the numbers shown in this review aren’t comparable to previous articles. All of the drives here have also been updated to their latest firmware and where applicable.

HotHardware Test System
Intel Core i7 and SSD Powered
Processor -

Motherboard -


Video Card -

Memory -

Audio -

Storage -

AMD Threadripper 3990X

MSI TRX40 Creator
(TRX40 Chipset)

GeForce RTX 2080 Ti

32GB G.SKILL DDR4-3200

Integrated on board

Corsair MP600 (OS Drive)
Samsung SSD 860 Pro (2TB)
Samsung SSD 870 QVO (1TB, 2TB)
Toshiba OCZ VX500 (1TB)
OS -

Chipset Drivers -

DirectX -

Benchmarks -
Windows 10 Pro x64 (1909)

AMD v2.04.28.626

DirectX 12

HD Tune v5.75
ATTO v4.01.0f
AS SSD
CrystalDiskMark v7 x64
PCMark 10 Quick Storage Bench
SiSoftware SANDRA
SiSoft SANDRA
Synthetic Disk Benchmarking

Next we used SiSoft SANDRA, the the System ANalyzer, Diagnostic and Reporting Assistant for some quick tests. Here, we used the File System Test and provide the results from our comparison SSDs. Read and write performance metrics, along with the overall drive score, are detailed below.

sandra

The new Samsung SSD 870 QVO drives take the top two spots here, though what you'll see is that all of the drives we tested are bumping into the limits of the legacy SATA interface. Only a few MB/s separate all of the drives here.

ATTO Disk Benchmark
More Information Here: http://bit.ly/btuV6w

ATTO is another "quick and dirty" type of disk benchmark that measures transfer speeds across a specific volume length. It measures raw transfer rates for both reads and writes and graphs them out in an easily interpreted chart. We chose .5KB through 64MB transfer sizes and a queue depth of 6 over a total max volume length of 256MB. ATTO's workloads are sequential in nature and measure raw bandwidth, rather than I/O response time, access latency, etc.

atto 1


atto 2

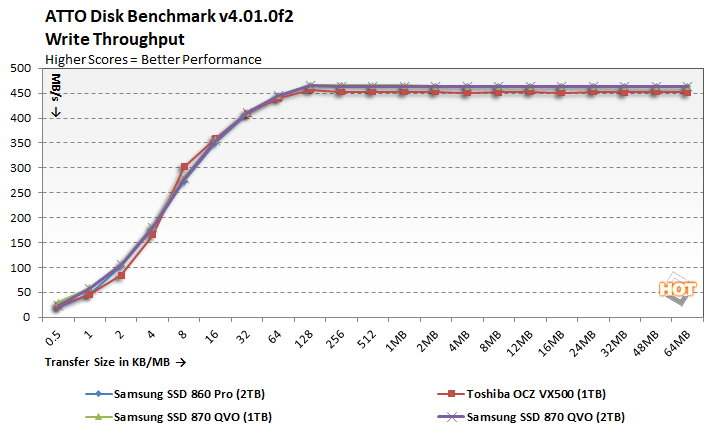
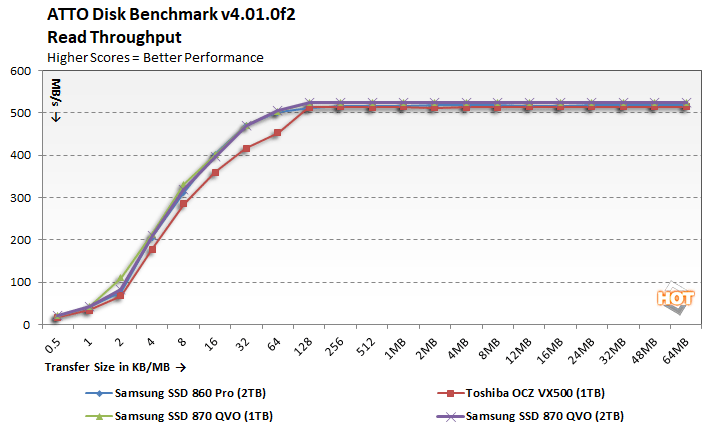
In ATTO's read and write bandwidth tests, all of the drives are tightly grouped once again, with the Samsung drives taking a marginal lead with the smallest block sizes, particularly in the read test.

atto 3

atto 4

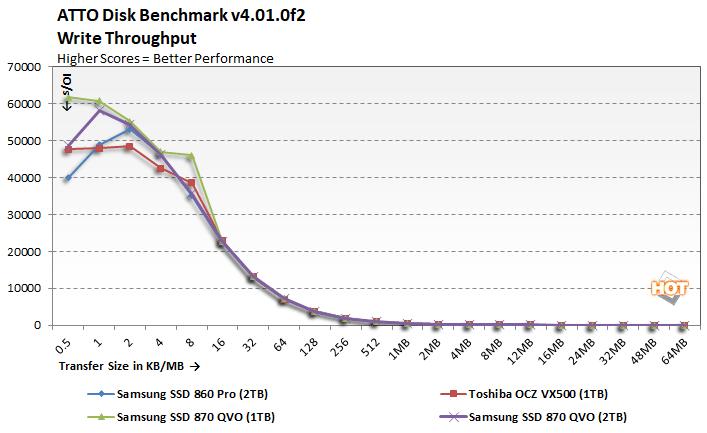
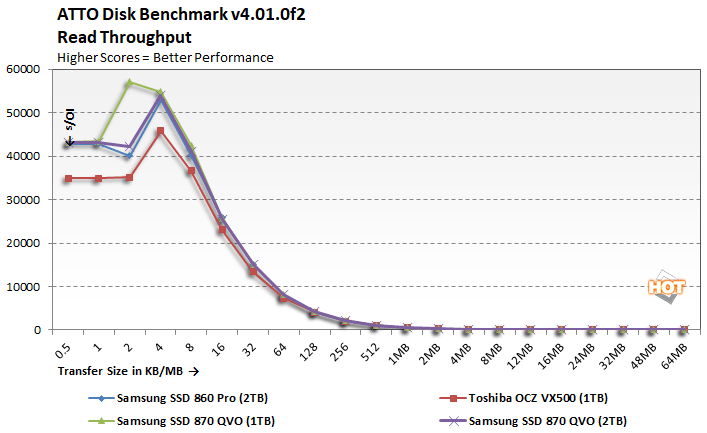
There's not much separating these SSDs in terms of IOs either, though technically the Samsung 870 QVOs sandwich the 860 Pro at the smallest block sizes, before things level out.


AS SSD Compression Benchmark
Bring Your Translator: http://bit.ly/aRx11n


Next up we ran the Compression Benchmark built-into AS SSD, an SSD specific benchmark being developed by Alex Intelligent Software. This test is interesting because it uses a mix of compressible and non-compressible data and outputs both Read and Write throughput of the drive. We only graphed a small fraction of the data (1% compressible, 50% compressible, and 100% compressible), but the trend is representative of the benchmark’s complete results.

as ssd 1


as ssd 2

The compressibility of the data being transferred across the drives has no impact on performance, and once again, we see all of the drives performing similarly. There's only so much bandwidth available over the SATA interface and all of the drives we tested are able to saturate it fully.

Related content