Solidigm SSD D5-P5430 Review: Speedy, Dense Data Center Storage
Solidigm SSD D5-P5430 Review: Increasing Desity And Reducing TCO

| Solidigm SSD D5-P5430: $0.08 - $0.10 per GB (Estimated) The new Solidigm SSD D5-P5430 features the company's latest QLC NAND flash memory, with read speeds up to 7GB/s and capacities topping out at over 30TB.
|
|||

|

|
||
Solidigm is expanding its data center SSD line-up, with a new series of drives designed to maximize density and reduce TCO. The new Solidigm SSD D5-P5430 series is somewhat of a mid-range offering that slots in underneath the company’s D7-P5520 and D7-P5620 series TLC-based drives. Unlike those drives, the Solidigm SSD D5-P5430 is outfitted with 192-Layer QLC NAND flash memory to drive capacities up and costs down, and it's tuned for more mainstream, read-centric workloads. The drive's SSD controller, however, is similar to Solidigms D7-series drives. Take a look at the high-level features and specifications below and then we’ll dig in a bit further to see how the new Solidigm SSD D5-P5430 performs...
Solidigm SSD D5-P5430 Specifications & Features
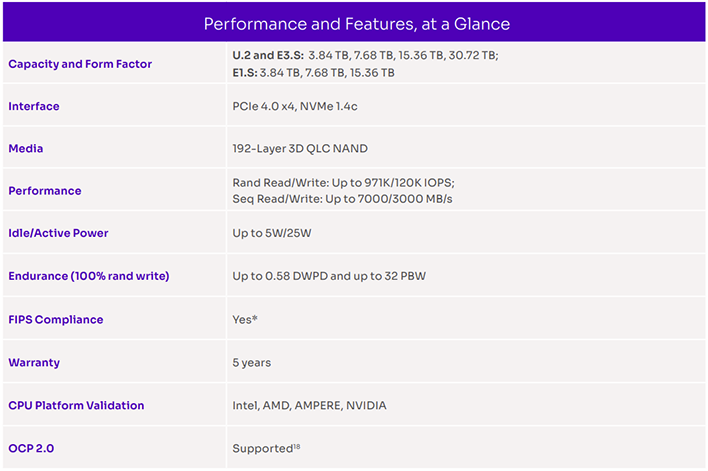
The new Solidigm SSD D5-P5430 series drives we’ll be showing you here will be offered in a variety of form factors, including U.2 (15mm), E1.S (9.5mm), and E3.S (7.5mm), and will be offered in capacities from 3.84TB all the way on up to a beefy 30.72TB (the smaller E1.S 9.5mm drives top out at 15.36TB).
The specs vary somewhat between capacities and form factors (up to 971K / 120K random IOPS, and sequentials up to 7GB/s reads and 3GB/s writes), but the Solidigm website has an easy compare feature available, should you be considering its various form factors.


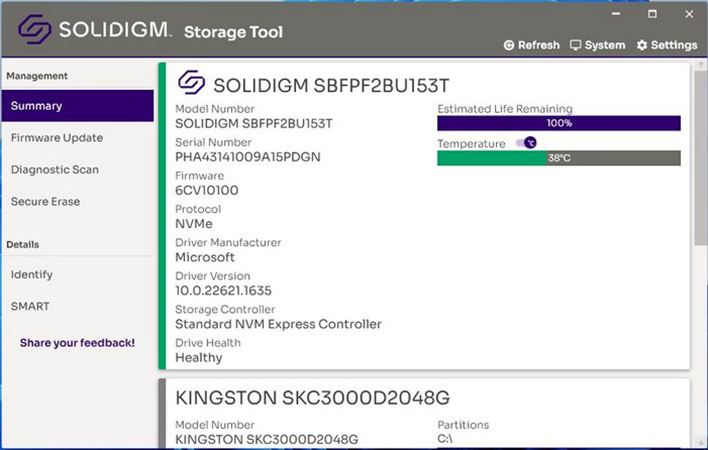
As you’d expect from a data center focused products such as this, Solidigm offers management, update, and maintenance software for the SSD D5-P5430 series, for both Windows and Linux. The Solidigm Storage Tool (for Windows) offers a modern GUI, with a few diagnostic and maintenance tools to keep the SSDs performing optimally. This is actually a universal tool that works with any Intel or Solidigm data center SSD (Intel Optane requires the Intel MAS GUI), which gives users the ability perform such operations as updating the firmware on the drive, secure erasing it or sending a TRIM command to the drive with the SSD Optimizer to clean-up cells that are no longer in use.
Solidigm SSD D5-P5430 Test Setup And Benchmarks
Under each test condition, the SSDs tested here were installed as secondary volumes in our testbed, with a separate drive used for the OS and benchmark installations. Our testbed's motherboard was updated with the latest BIOS available at the time of publication and drives were left blank without partitions for some tests, while others required them to be partitioned and formatted. Windows firewall, automatic updates, and screen savers were all disabled before testing and Windows Quiet Hours / Focus Assist was enabled to prevent any potential interruptions.

In all test runs, we rebooted the system, ensured all temp and prefetch data was purged, waited several minutes for drive activity to settle and for the system to reach an idle state before invoking a test. All of the drives featured here were tested with their own NVMe drivers installed where possible / available, but the default Microsoft NVMe driver was used when a proprietary driver was unavailable. Also note, we compare of mix of PCIe Gen 4 and Gen 3 drives here to illustrate how the Solidigm SSD D5-P5430 compares to other Solidigm drives we've previously tested and some competing offerings.
IOMETER Benchmarks
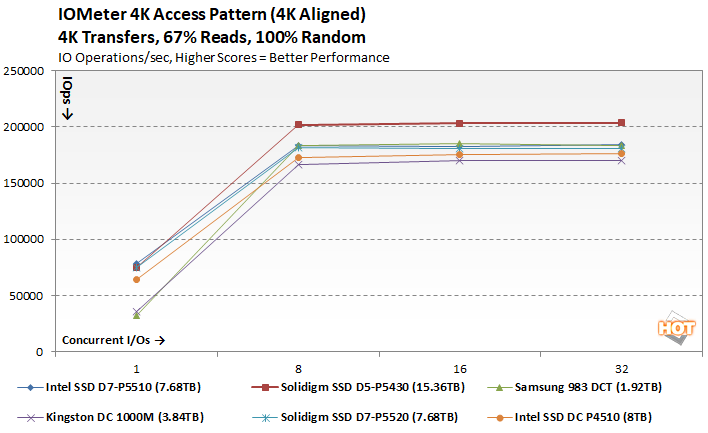
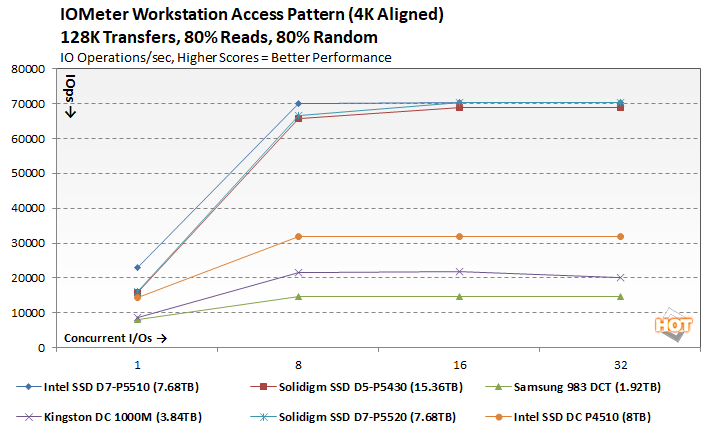
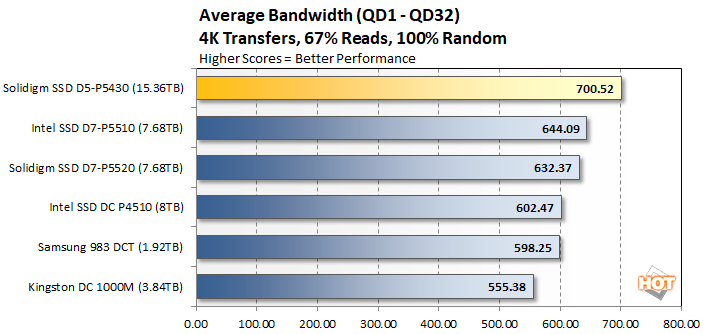
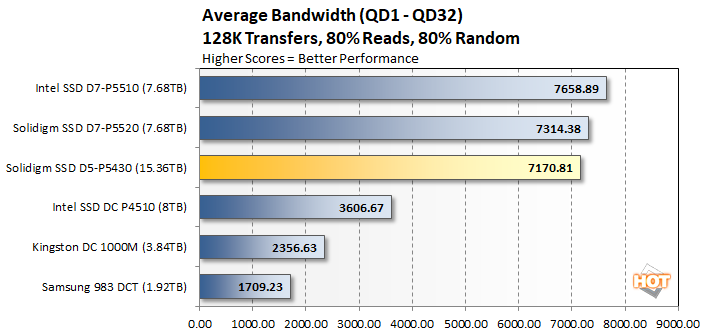
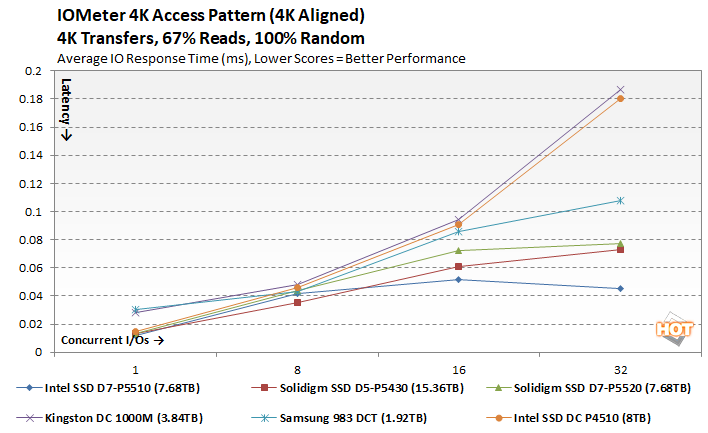
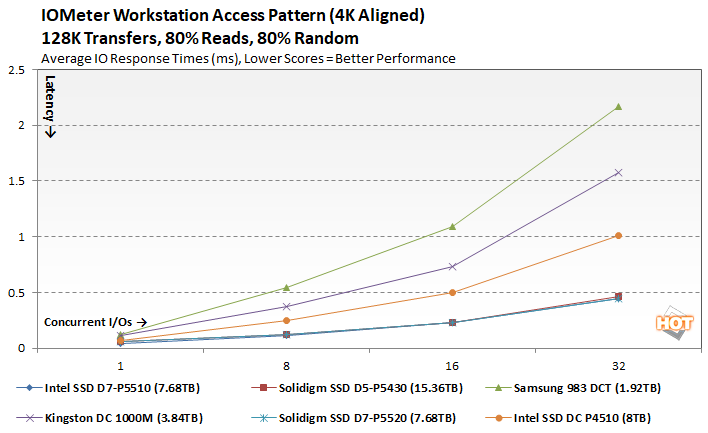
As we've noted in previous solid state storage articles, though IOMeter is clearly a well-respected industry standard benchmark too, we're not enamored with it for testing SSDs. The fact of the matter is, though our results with IOMeter scale, it is debatable whether or not certain access patterns, as they are presented to and measured, actually provide a valid example of real-world performance. The access patterns we tested may not reflect your particular workload, for example. That said, we do think IOMeter is a reliable gauge for relative available throughput, latency, and bandwidth with a given storage solution. In addition, there are certain higher-end workloads you can place on a drive with IOMeter, that you can't with most other storage benchmark tools available currently.In the following tables, we're showing two sets of access patterns; a custom Workstation / Server pattern, with a 128K transfer size, consisting of 80% reads (20% writes) and 80% random (20% sequential) access and a 4K access pattern with a 4K transfer size, comprised of 67% reads (33% writes) and 100% random access. Queue depths from 1 to 32 were tested.
ATTO Disk Benchmarks: Bandwidth & IOs
ATTO is straightforward disk benchmark that measures transfer speeds across a specific volume length. It measures raw transfer rates for both reads and writes and graphs them out in an easily interpreted chart. We chose .5KB through 64MB transfer sizes and a queue depth of 4 over a total max volume length of 256MB. ATTO's workloads are sequential in nature and measure bandwidth and IOs, rather than response times, access latency, etc.
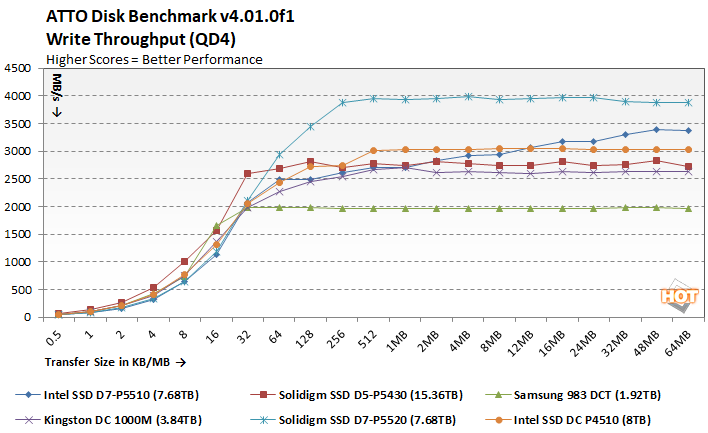
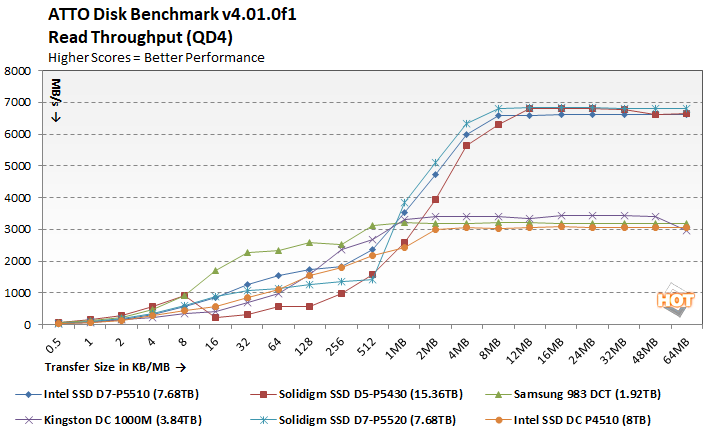
The Solidigm SSD D5-P5430 is designed for read-intensive workloads, and it shows in the write test here, where it lands about in the middle of the pack (as expected). In the read test, the Solidigm SSD D5-P5430's performance drops off transfer sizes in the 16 - 512K range, but it picks back up and hangs with the higher-end D7-series drives with the larger transfer sizes.
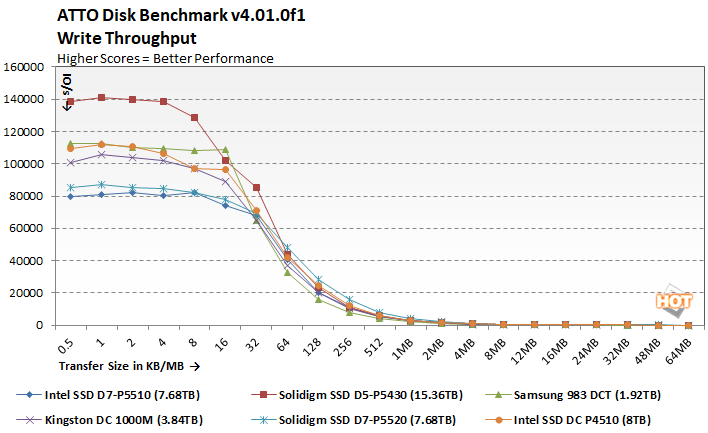
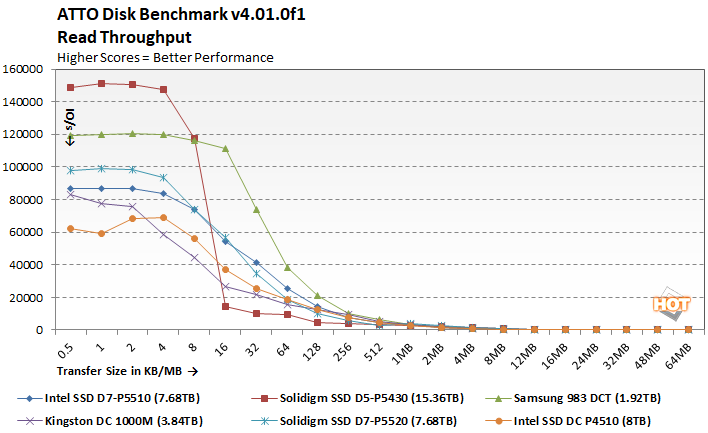
Peak IOs across the various transfer sizes show the Solidigm SSD D5-P5430 leading wtih the smallest transfers, but again we see things dropping off from 16 - 512K in the read test.
SiSoft SANDRA Physical Disk Test
Next we used SiSoft SANDRA, the the System ANalyzer, Diagnostic and Reporting Assistant for some quick tests. Here, we used the Physical Disk test suite and provide the results from our comparison SSDs. The benchmarks were run on clean drives that lacked any partitions. Read and write performance metrics are detailed below.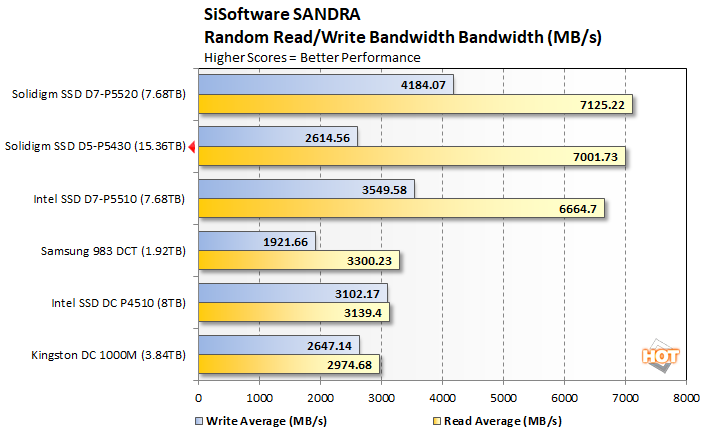
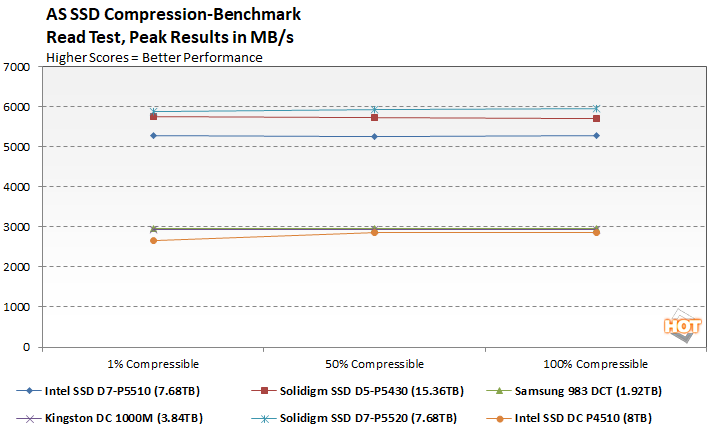
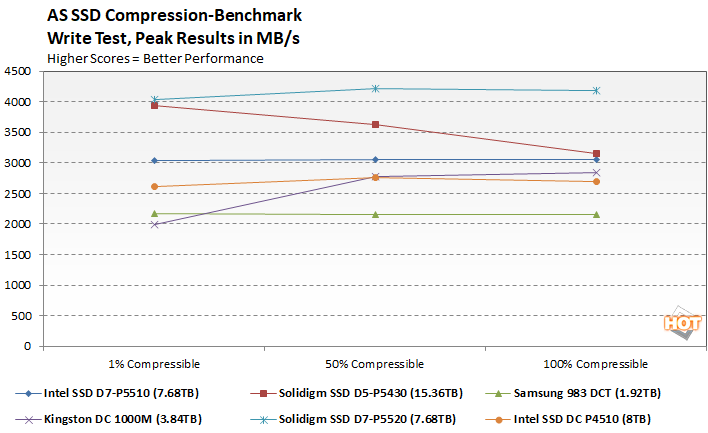
AS-SSD Compression Benchmark
Here we ran the Compression Benchmark built-into AS SSD, an SSD specific benchmark being developed by Alex Intelligent Software. This test is interesting because it uses a mix of compressible and non-compressible data and outputs both Read and Write throughput across the drive. We only graphed a small fraction of the data (1% compressible, 50% compressible, and 100% compressible), but the trend is representative of the benchmark’s complete results.