2014 Dell XPS 13 Ultrabook With Touch Review
Benchmarks: SiSoft SANDRA and Cinebench
In order to get a feel for how the Dell XPS 13 compares to other ultrabooks on the market, we ran a few established benchmarks. We began our benchmark testing with SiSoft SANDRA and Cinebench.
|
We began our testing with SiSoftware's SANDRA, the System ANalyzer, Diagnostic and Reporting Assistant. We ran four of the built-in subsystem tests (CPU Arithmetic, Multimedia, Memory Bandwidth, File System).
;)
;)
SANDRA CPU and Multimedia Benchmarks
;)
;)
SANDRA Memory and File System Benchmarks
The CPU and Multimedia scores from the XPS 13 are excellent, showing the power that’s inside of this ultrabook. The XPS 13 didn’t perform as well as the ThinkPad X1 Carbon in the Memory Bandwidth test, but it still earned very respectable scores at 15.5 - 16GB/sec. The Physical Disk test returned scores that are in line with what we’d expect from the hardware that powers the XPS 13 and a nimble Solid State Drive, exceeding 500MB/sec.
|
Cinebench R11.5 is a 3D rendering performance test based on Cinema 4D from Maxon. Cinema 4D is a 3D rendering and animation suite used by animation houses and producers like Sony Animation and many others. It's very demanding of processor resources and is an excellent gauge of pure computational throughput.
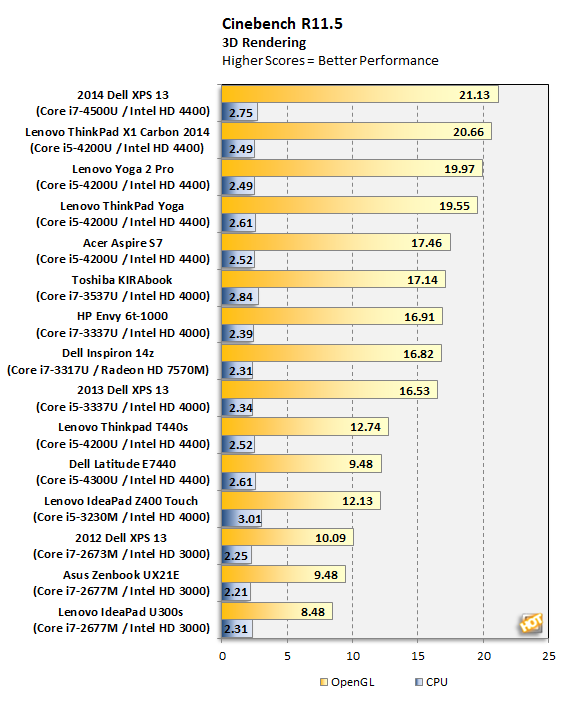
As you can see here, the XPS 13 took the top spot in the OpenGL test and earned third place in the CPU benchmark. Even at third place in the CPU test, you can see that there’s a relatively small margin between the scores of the top-placing Lenovo IdeaPad Z400 touch and the XPS 13.


