Maximizing Ryzen 5000 Performance With AMD Curve Optimizer
How To Squeeze Every Bit Of Performance Out Of An AMD Ryzen 5000 Series Processor

If our recent Zen 3 Ryzen review is anything to go by, one-click overclocking via Ryzen Master does add a small but measurable boost to an already-potent due of Ryzen 9 CPUs. The process is simple enough, too: open a software tool, click a button, reboot, and wait. Clicking a single button is just not as satisfying as tweaking the knobs and switches by hand though, and we can't help but think there's still more performance locked away inside the processor. Recently, AMD gave tweakers the gift of a remarkably simple tool to dynamically adjust the voltage and speed matrix the processor uses to adjust itself on the fly. Many motherboard makers have included the Power Curve Optimizer which AMD announced in November in the latest BIOS updates for many of their 500 and 400 series motherboards.

AMD Power Curve Optimizer Usage
Ryzen processors use a table with multiplier and voltage values, which are possible clock speeds that the processor will use depending on the workload, power budget, temperature, and other factors. The new Power Curve Optimizer, or PCO, allows us to shift all the entries on that table up or down, adding voltage (and generating more heat, something we're not really interested in today) or reducing it for each multiplier step. Negative adjustments are pretty interesting, because if the chip can handle it, the PCO can goose the chip into running faster at a given voltage and get some more performance. You might recall a similar approach taken by ClockTuner for Ryzen by Yuri Bubliy. The difference here is that the Power Curve Optimizer comes directly from AMD and runs at the BIOS level, rather than a third-party Windows app. The distinction is pretty huge, as this is sanctioned by AMD.This goes hand-in-hand with AMD's other power optimization tool: Precision Boost Overdrive. AMD says PBO 2.0 has several advantage over the previous version that was part of Zen 2 CPUs, including improved single-threaded performance. The power budget increases are applied to Ryzen 3000 CPUs on a Core Complex level, where PBO is more fine-grained than that. We've already talked about PBO 2.0 and PCO when AMD made its announcement, so you may want to read up on them before proceeding.
We're testing on a Ryzen 7 5800X purchased at retail with an ASUS TUF Gaming X570 Plus Wi-Fi, 32 GB of Corsair DDR4-3600 CL16 memory, and a GeForce RTX 3070 Founder's Edition. This potent system has eight Zen 3 cores with a maximum, default boost clock of 4.7 GHz. Because we're overclocking our CPU, it only made sense to use the best cooler we had available: a DeepCool Castle 280EX with a pair of Noctua NF-P14s Redux fans with a maximum speed of 1,500 RPM.
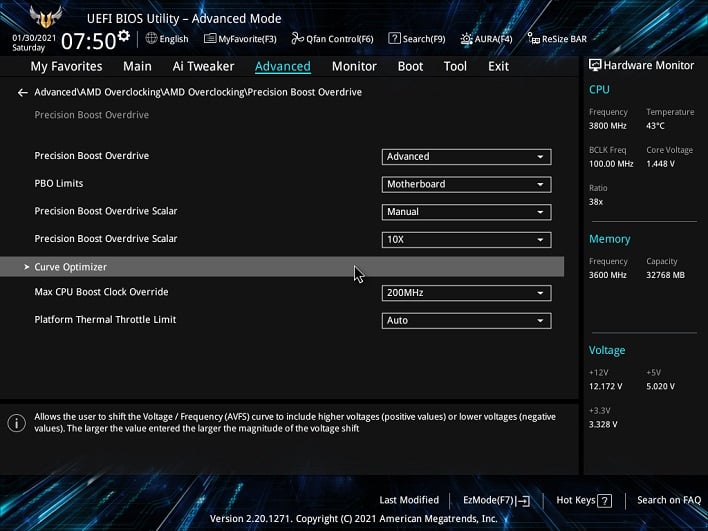
Before we begin, remember that overclocking is never a guarantee, but we wanted to see how far we could push our processor. We allowed AMD's firmware to handle just about everything from voltage to clock speeds. All we did was set the Max CPU Boost Clock Override to 200 MHz and set the Precision Boost Overdrive Scalar to 10X. Then it was time to dive into the Curve Optimizer menu, which has two settings: Per Core or All Cores. AMD suggested that we might have better success hitting higher clocks if we tweaked each core individually, so that's where we started.
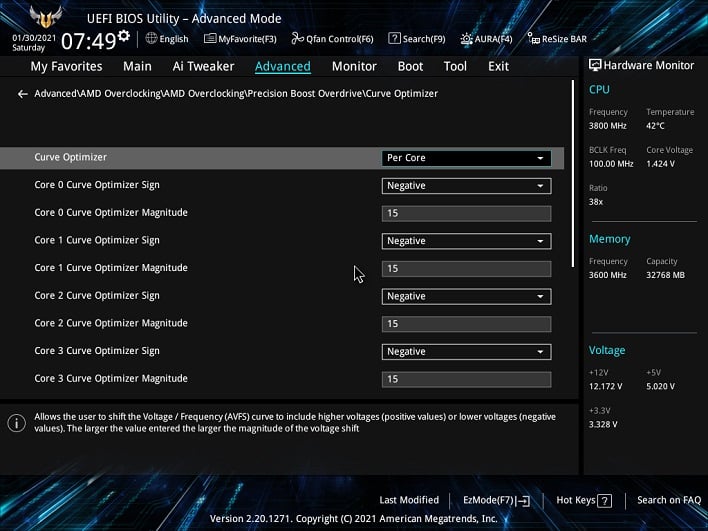
We already knew that Ryzen Master identified our processor's two fastest cores as Core 0 and Core 1, so they got the biggest negative offset to push for higher speeds. Once we hit their limit, we could start adjusting other cores. Each offset indicates a difference of around 2 mV to 3 mV, and tweaking each core to get its best performance took the better part of a day, and then a couple hours of torture testing. We started out small with a -5 offset on each core, but by the time we were done, we'd landed on a -15 offset for our four fastest cores and a -5 offset on the remaining four cores.
We also backed off the PBO scalar to 2X, which was still stable but allowed our CPU to consume around 10 Watts fewer under load according to Ryzen Master, with a slight decrease in temperatures. Backing off on this aggressive setting is definitely worth considering if you hit a thermal wall. With the PBO Scalar set to 10X, we saw 125 W of power consumed during an all-core Cinebench run with temperatures up over 82 degrees Celsius. With the scalar dialed back to 2X, temperatures topped out at 78 C and power consumption was around 115 W.
AMD Power Curve Optimizer Results: 5 GHz+
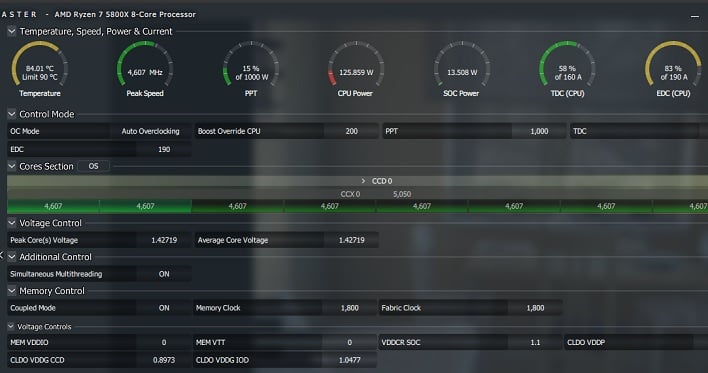
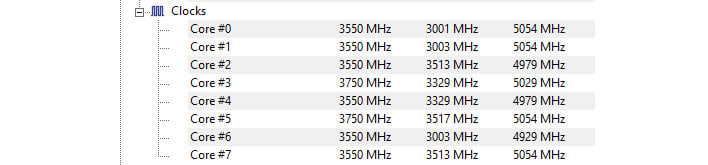
Our settings resulted in some pretty incredible clock speeds reported by Ryzen Master and HWMonitor. We hit a max of 4.625 GHz in an all-core workload like Cinebench R23, although that did eventually roll back to an even 4.6 GHz after a half hour. The single-threaded Cinebench workload saw the CPU maintain a pretty steady 5.05 GHz across one core, although which core hit the limit bounced around based on AMD's algorithms. Geekbench and HWMonitor corroborated 5.05 GHz as the maximum clock speed reported by the CPU, as well. That means we broke the 5 GHz barrier on our Ryzen 7 5800X and that's pretty impressive all by itself. Hitting the default maximum boost across all eight cores would have been a cherry on top, but alas, it was not meant to be. We're pretty confident that we've hit our CPU's limit, though, so it's time to dive into some benchmarks.
One other incredible thing about overclocking with PCO is that the CPU idles like normal. Cores go to sleep, voltages drop, temperatures stay low, and at idle our PC is very quiet. While it's fun to romanticize overclocking from back in the day, we sure don't miss 6,800 RPM Delta fans on the 3" cubes that passed for heat sinks. While modern CPU coolers do take up considerable space inside a case like our Fractal Design Define 7, the silence that accompanies a 280-mm radiator and a pair of 140-mm fans with temperature controls make us glad to be doing this in 2021.
AMD Power Curve Optimizer Tested
To document our CPU's overclocking journey, we took several checkpoints along the way. We ran a series of tests with just ASUS's DOCP, which is required to get our memory's 3,600 MHz XMP profile enabled. This is how the system normally ran day-to-day so it's a good baseline. We also tested with just Precision Boost Overdrive 2.0 enabled, then we let Ryzen Master take a stab at overclocking, and then finally with the Curve Optimizer. We also had intended to test with ASUS's automatic overclocking in AI Suite 3, but it's a relatively inelegant tool by comparison that just set all cores to 4.2 GHz. Performance was actually worse than stock this way, so we skipped it. We tested on Windows 10 Pro with the 20H2 update installed and all of the power management settings at their defaults.Given that the change in maximum clock speed isn't really all that much, we don't expect to see too big of a shift in any of our tests. 350 MHz on the top end sounds like a lot, but it's not 2001 any more, so that only represents around 7% in total. That's the difference between the DOCP setting and the Curve Optimizer, and with the +200 MHz setting enabled for Power Boost Overdrive, it's likely that we'll see those configurations (with and without Ryzen Master's help) sit in the middle. There are other factors at play here as well, since the memory speeds didn't move at all. For that reason, 7% on the top end is probably the absolute maximum we'll see in any benchmark, and it'll likely be lower as other bottlenecks come into play.
|
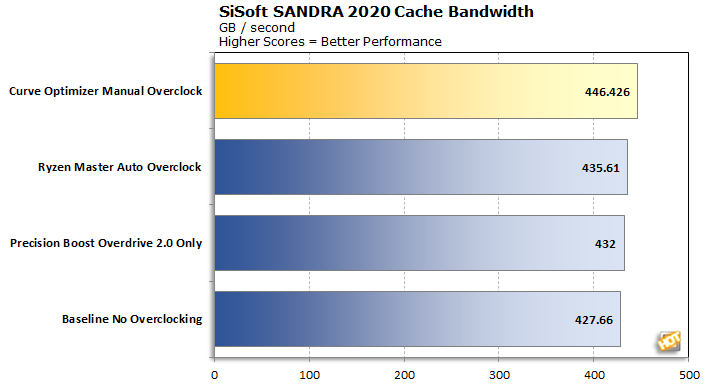
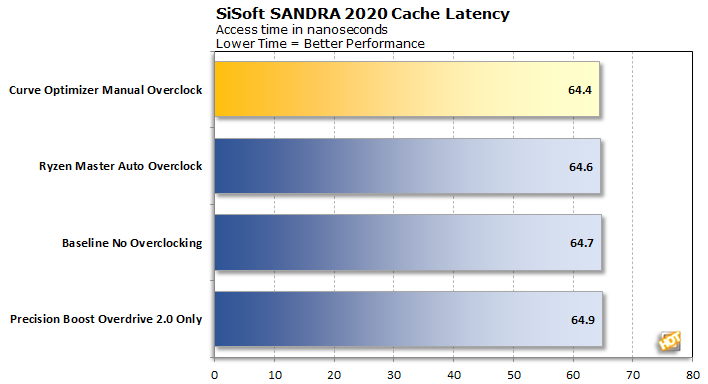
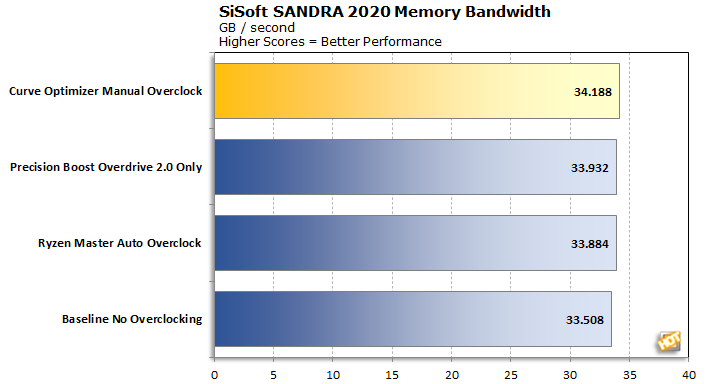
It makes sense that the fastest clock speeds would result in the lowest latency and fastest cache, so it's not a surprise to see the Curve Optimized version of the Ryzen 7 5800X sit at the top of those two charts. It's a little surprising to see that there's an effect on overall system memory bandwidth. It's not much, since we're talking about more than 33 GB per second, but we see a 2% advantage here for our manually-adjusted configuration, too.
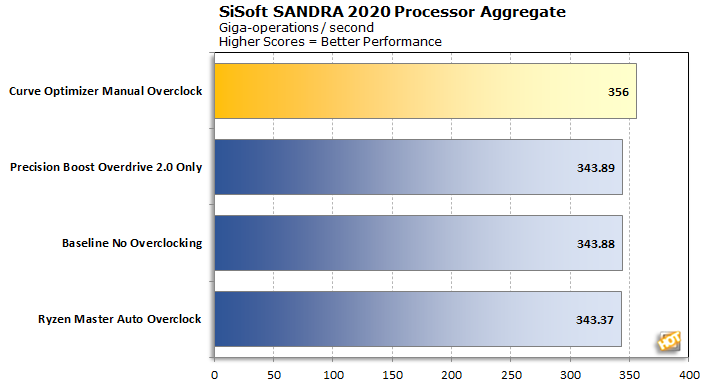
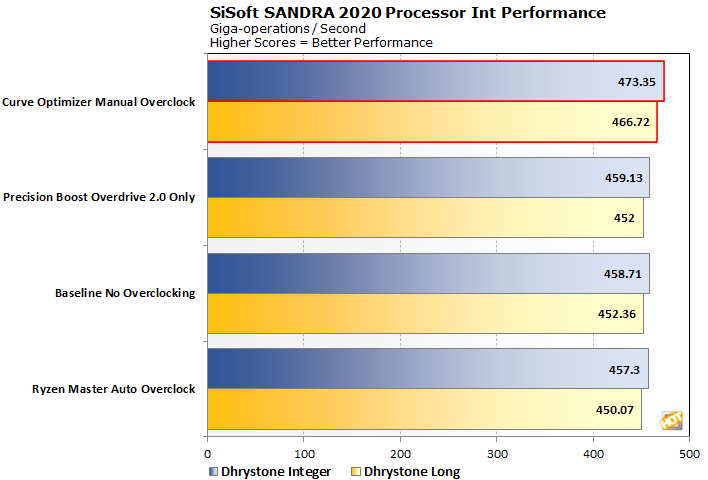

Even in pure mathematical throughput, 7% was overly optimistic. Our overclocked CPU took the lead in every single test, however, so at least we didn't lose anything for our trouble. We see around a 3% boost in all three of these tests, which likely sets the stage for the rest of our testing.
|
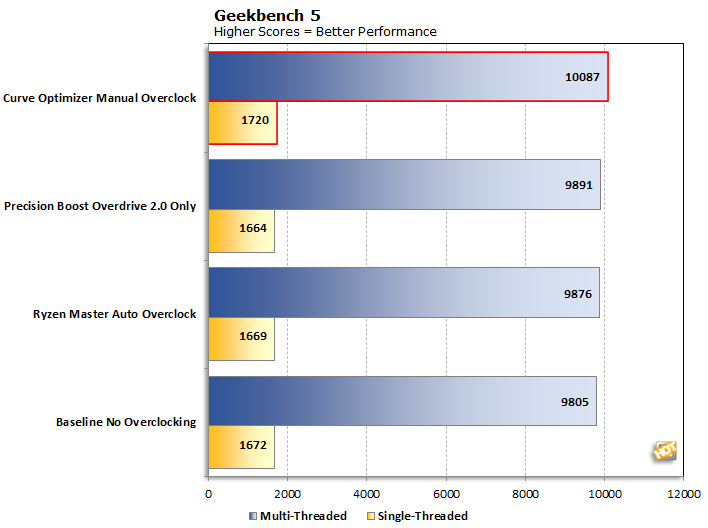
While the absolute percentage gains are not much to write home about, that mere 2.5% gain actually broke some new ground from a base-10 perspective. Our CPU finally pushed through the 10,000 barrier on the multi-threaded test and poked its head past 1,700 on the single threaded one. If we're just looking for bragging rights, that's not too shabby.
|
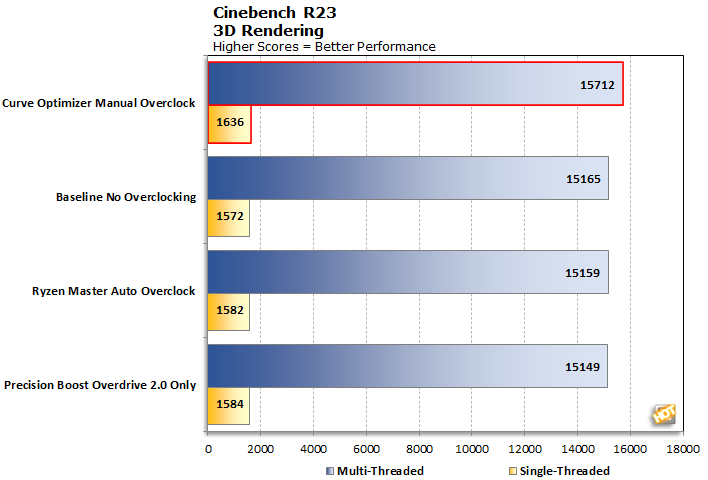
Cinebench saw larger than average gains. All three of the automatic options sit bunched together in a 16-point spread with only 12 points separating the fastest and slowest single-threaded options. It's a little weird to see the baseline score at the top of our list, too, but these are the median results of three runs and it was pretty consistently tight like this throughout. It's a margin of error to be sure. On the other hand, breaking the 5 GHz barrier got us a full 3.7% bump on the multi-threaded score and a similar 3.3% bump on single-threaded scores.
|
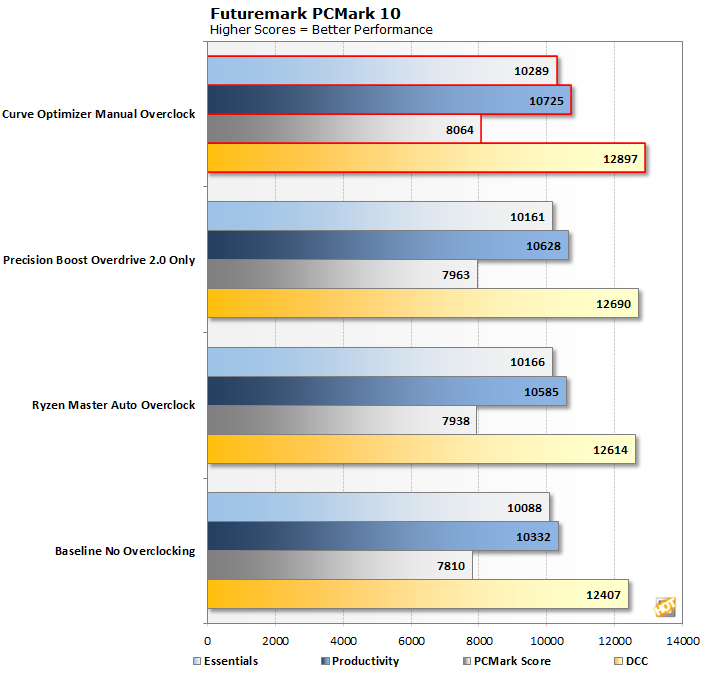
This time out, the overall gains are pretty modest between first and second place -- less than 2 percentage points. PCMark is a more holistic benchmark than the others here, so it's not a surprise, as other bottlenecks come into play with these tests.
|
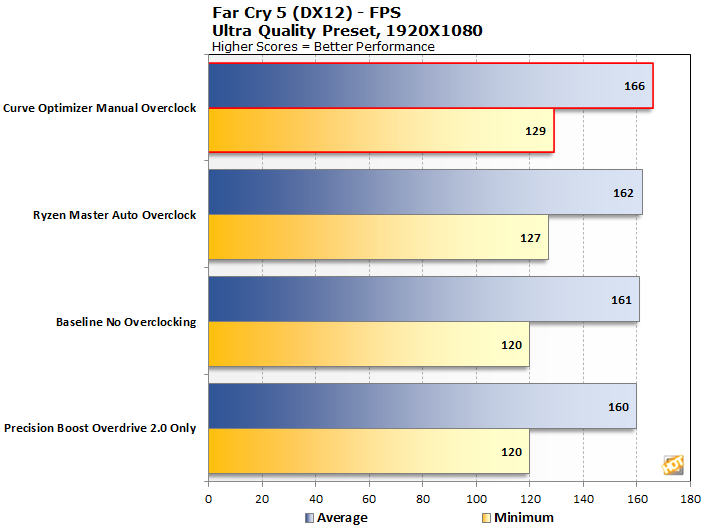
Our GeForce RTX 3070 can certainly play FarCry 5 at a higher detail level than medium, but the goal here is to get the graphics card out of the way. We wanted to see our CPU as the bottleneck, and it seems we've succeeded, at least a little. The difference is less than 4% between first and last place, but again it's consistent. It's not like this doesn't have a real-world application, either. Those who own high-refresh monitors like a 1080p 144 Hz G-Sync enabled display might be using this configuration to make sure the display is saturated with frames at all times, for example. The minimum frame rate fared much better than the average, gaining just about the full 7% than our clock speed advantage provides, meaning the CPU must be the limiting factor there.
|
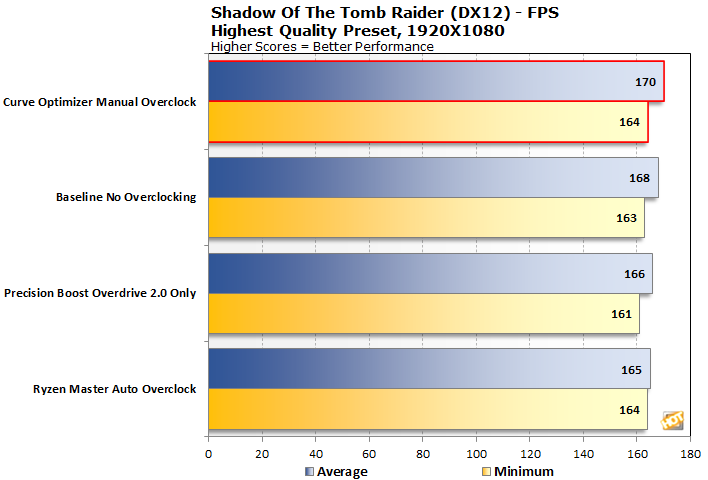
Last but not least, we see another poster child for a 1080p 144 Hz monitor. Unlike Far Cry, there's not much difference between minimum and average frame rates. We must be pushing against some sort of engine limitation here for the two metrics to be so close together.
|
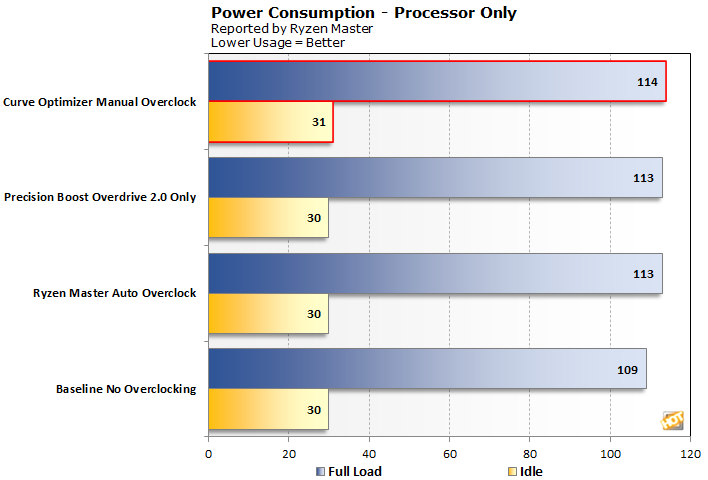
Well, this is a surprise. There's only a 5 Watt difference according to Ryzen Master in CPU power consumption with our undervolted underclock. We suppose in retrospect it shouldn't be so surprising, considering that temperatures didn't shift much. Our Ryzen 7 5800X pushes itself as hard as the AGESA will allow it, and temperatures in any of these configurations never exceeded 80 degrees Celsius. Remember that we're trying to get the CPU to do more work in the same power envelope, so the numbers make sense.
The one exception, which isn't charted, is using AMD's own recommended settings that included changing the PBO scalar to 10x. We didn't keep it that way, and the performance here doesn't reflect it, so it didn't make the chart. For the curious, it did push temperatures up closer to 85°C while not bringing an extra iota of performance. Power consumption there was around 125 Watts. That's around 14% more power than the CPU's default, which is not trivial. The scalar would likely help in situations where a little extra voltage will keep things stable. We ran into a hard wall where that wasn't the case, but others might have a different experience. In that case, as long as temps can be controlled, a bit more power might come in handy.
Ryzen 5000 Overclocking Conclusions
AMD's Precision Boost Overdrive 2.0 and Power Curve Optimizer was the company's holiday gift to tweakers and enthusiasts. Unlike more crude overclocking methods like just setting a multiplier, PBO 2.0's enhancements allow processor cores to hit their peak performance when it's needed, yet still reduce power consumption and go to sleep when they sit idle. The result is a cool and quiet PC when it's not being pushed, and a nice, measurable bump in performance when it's under load.
The most obvious use case for an overclocked Zen 3 processor right now is gamers with a high-refresh rate display who want to get the highest frame rates out of their games. Competitive e-sports players are looking for every last frame, and PCO offers that to them. Another possible benefit might be just a little ways down the road yet, however. We have high hopes for getting the most out of AMD's lower-power, non-X variants. A theoretical Ryzen 7 5800 or Ryzen 9 5900 (both of which have popped up in rumors) with the same core and cache counts, but a lower TDP, could stand to gain an awful lot from technology like this.
There are two things to keep in mind when overclocking. First of all, no two CPUs are alike. Just because we got over 5 GHz with our retail sample doesn't mean that you will, but on the other hand, you could surpass our results -- it's just the luck of the draw. Second, be sure to bring a beefy cooler along for the ride. There's a reason we chose the DeepCool Castle 280EX -- it's the best cooler we had on hand. Bear these two things in mind, and get cranking.


