Dell XPS 15 (9570) Review: Same Beauty, Even More Beast
Dell XPS 15 (9570): Storage, Productivity And Content Creation Tests
To start things off and get a sense for how the new XPS 15's storage components perform, we fired-up ATTO for a quick sanity check on sequential disk transfer speeds across various file sizes, with both read and write workloads.
ATTO Disk Benchmark, Testing NVMe Solid State Storage
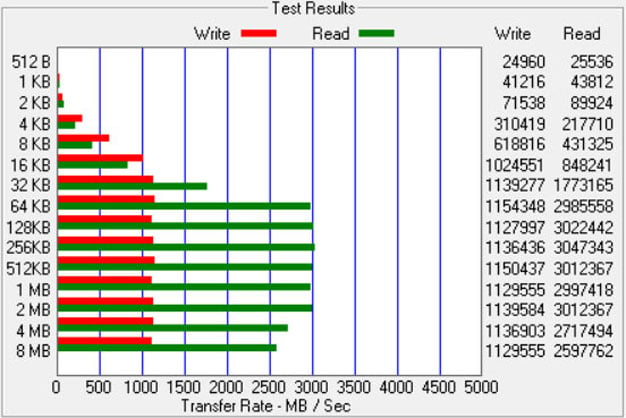
The system’s Toshiba MVMe-based SSD has a 512GB capacity and offers admirable performance. Read rates were over 3GB/s for much of the test suite, and write speeds topped 1.1GB/s.
Geekbench And Cinebench
We kicked off our general purpose benchmarks with a cross-platform CPU compute benchmark called Geekbench and then ran Cinebench R15, a 3D rendering benchmark that tests both the CPU and GPU engines in the processor. Cinebench is developed by Maxon, which is better known for its Cinema 4D software employed in professional 3D rendering and animation studios. We use both of Cinebench’s integrated tests for CPU and GPU.


Cinebench OpenGL results were slightly better than the Dell XPS 15 2-in-1, showing that the NVIDIA GeForce GTX 1050 Ti GPU is a close competitor to AMD Radeon RX Vega M graphics. However, the Core i7-8750H processor again runs away with the Cinebench multi-core CPU test. It’s no contest -- the XPS 15 2-in-1, XPS 13, and Lenovo ThinkPad X1 Carbon’s scores were tightly packed together, but the new XPS 15 is ahead of them all by about 500 points.
PCMark 10 Benchmarks
Next, we'll move from pure content creation in Cinebench, to productivity and mixed usage with PCMark. We're representing all tests from the PCMark 10 benchmark suite, including the Essentials, Productivity, Digital Content Creation and and total PCMark score. The Essentials test covers workloads like web browsing, video conferencing and app start-up times, while Productivity tests everyday office apps from spreadsheets to word processing. Finally, Digital Content Creation tests performance of a machine with respect to photo and video editing, as well as rendering and visualization workloads.


