Intel 4th Gen Xeon Scalable Sapphire Rapids Performance Review
Intel 4th Gen Xeon Scalable CPU: General Compute Workloads
HotHardware's Server Test Setup
Both of our Intel 4th Gen Xeon and AMD EPYC systems are running Ubuntu Server. We updated the Linux kernels to 5.15.0-57-generic, with the governor set to Performance. We installed the Phoronix Test Suite, all of our targeted benchmarks, and then a final apt update/upgrade cycle.As with Genoa, we have chosen to use the Phoronix Test Suite because it offers both a wide variety of tests to choose from and ease of reproducibility. For reference, we'd encourage you to visit openbenchmarking.org for additional information, reference numbers, and to compare your own existing infrastructure against these workloads, if you'd like.
All Genoa numbers presented here were re-run for this review. Most tests remained within run-to-run variance, although a couple had more substantial shifts. We will address those as we get to them.
Coremark 1.0.1 Benchmark
We begin our testing with Coremark. Coremark is a very quick no-nonsense multi-threaded CPU test intended for quick comparisons.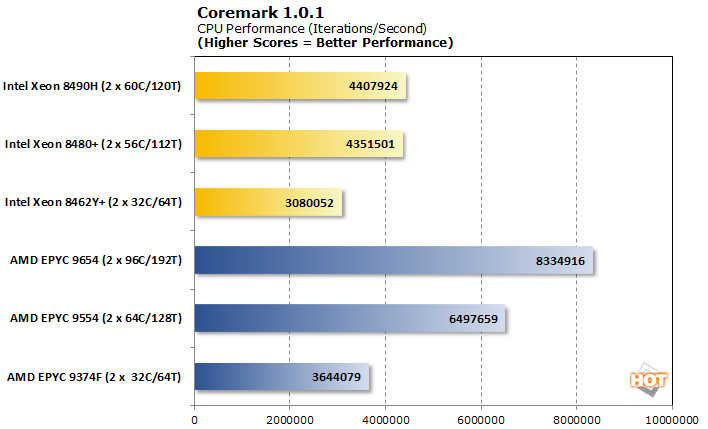
Coremark starts us off with a startling difference between the Xeon and EPYC platforms. First, let’s look at the only true core-for-core comparison we have, pitting the Xeon 8462Y+ against the EPYC 9374F with 32 cores per socket each. The EPYC 9374F holds a top-end clock speed advantage of only about 200MHz, but its base clock sustains a much higher 3.85GHz to the Xeon 8462Y+’s 2.8GHz base. With an all-core load like this, CPU base clock advantage becomes much more relevant.
At the top end, Intel’s Xeon 8480+ and 8490H CPUs are non-competitive to AMD’s 64-core EPYC 9554 here, to say nothing of the 96-core EPYC 9654. Again, AMD holds a greater-than 1GHz base clock lead over either of these Intel contenders with more cores per socket as well.
7-Zip 1.10.0 Compression/Decompression
Next, we looked at 7-Zip compression and decompression. The compression workload is influenced by memory and cache performance as well as out of order processing. Decompression is much more integer-driven, but also stresses the branch prediction pipeline.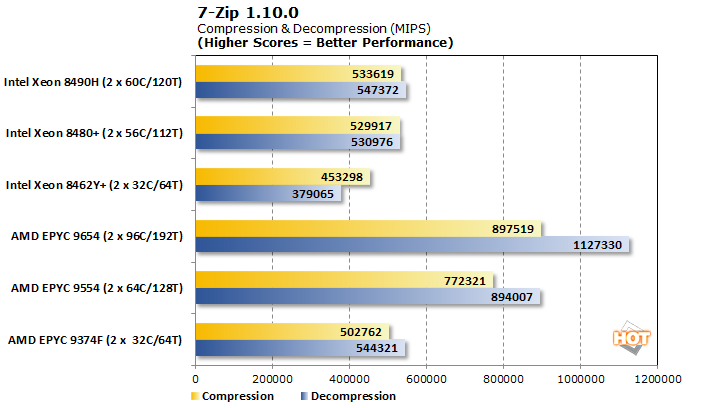
The 7-Zip workload demonstrated a similar rank ordering to Coremark, although the 56-core and 60-core Intel Xeon processors fall further behind here. While the performance deltas in the compression workload are large, those in the decompression subtest are even greater, which suggests reduced memory bandwidth from 8-channels vs 12-channels is not the culprit.
Linux Kernel Compilation 1.15.0
Software compiling is a common task and building the Linux kernel itself has long been used as a performance benchmark. We tested with defconfig and allmodconfig with results reported in seconds.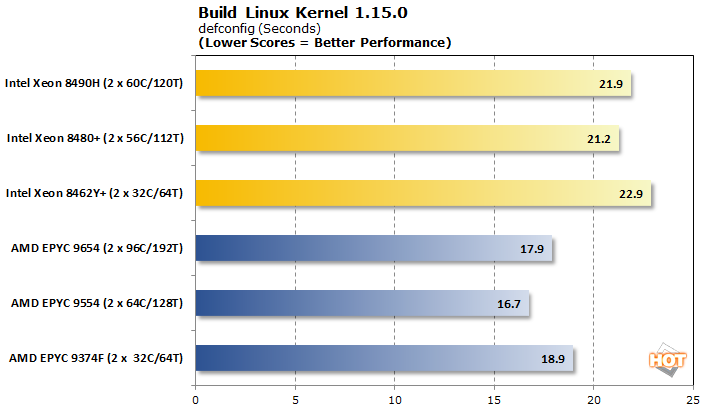
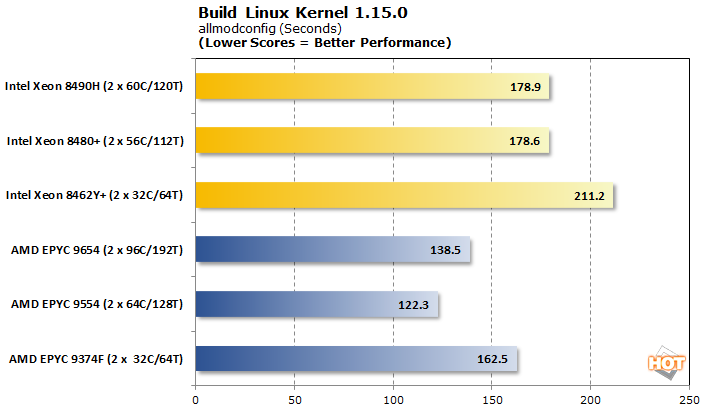
When it comes to compiling software, AMD EPYC scores a clean sweep but by less of a margin. Interestingly, both platforms appear to have a performance sweet spot with the respective middle-tier chips.
DaCapo Benchmark 1.0.1
The DaCapo benchmark suite evaluates the performance of the CPU and system as a whole in the context of Java. In particular, we are using the Jython test which has become popular among Python developers who want to develop in a Java environment.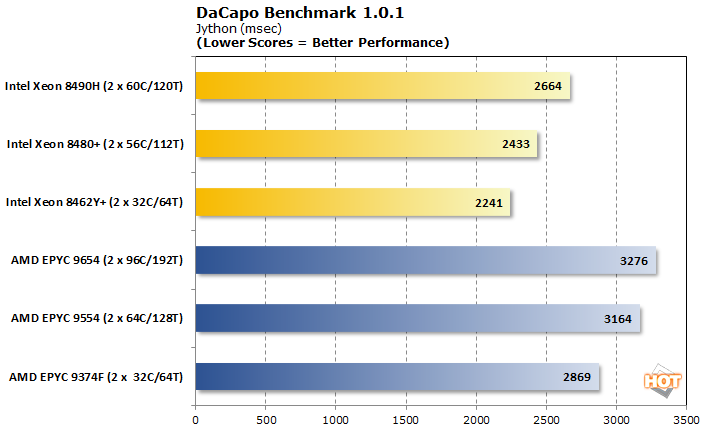
Our DaCapo results present an inverse of the Linux Kernel results, with Intel clearly leading the way—remember, lower is better here. A closer look, though, reveals a curious trend where performance drops off with additional cores for both the blue and red teams, however slight. These lower core-count parts tend to have better memory and inter-core latencies to keep Java running at full speed, versus sheer brute force compute.
Blender BMW 3.4.0 Model 3D Rendering
Blender is a staple 3D rendering benchmark. We queued up the tried and true BMW scene and gauged the time to render in seconds.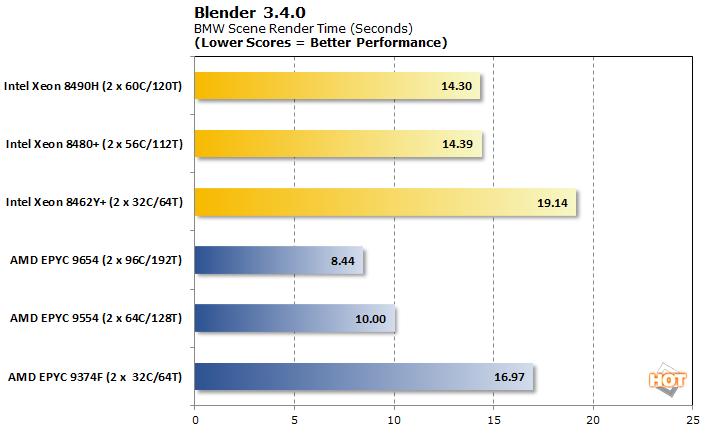
Blender brings us back to an AMD advantage (no pun intended). Performance does appear to scale well with core counts here, but core-for-core the Intel processors trail the AMD counterparts.
Embree 1.2.1 3D Rendering
Embree is a 3D path-tracing renderer which can leverage instruction sets like AVX2 and AVX512. The IPSC variant is compiled using the Intel Implicit SPMD Program Compiler which can see additional speedup when AVX acceleration is available.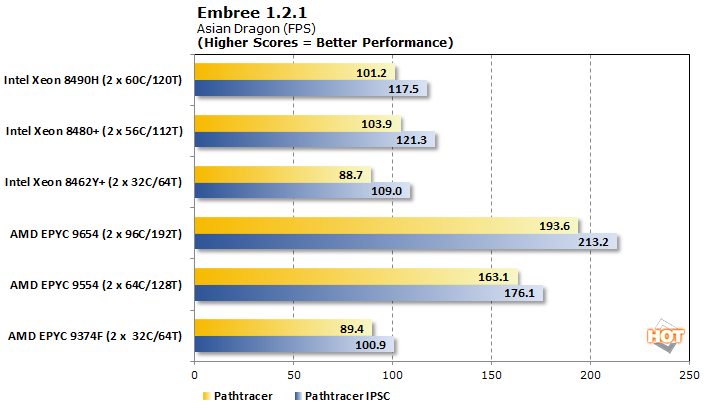
Ranking is similar in both scenarios. Most noteworthy is the lack of per-core scaling from the Intel chips. The likely culprit is Intel’s segmentation of the AVX/AVX-512 accelerator on the tile, which is near-equivalent across models. AMD’s AVX implementations are at the core-level, so it benefits from scaling core counts. This can also explain the Xeon 8462Y+’s breakeven with or even slight lead over the EPYC 9374F. We will note that this is a workload where both the EPYC 9554 and 9654 picked up a bit of performance over our original testing.
x264 2.7.0 Video Encode
Another common use of these servers is to serve as a render farm for video. We used the multithreaded x264 encoder with both 1080p and 4K test footage.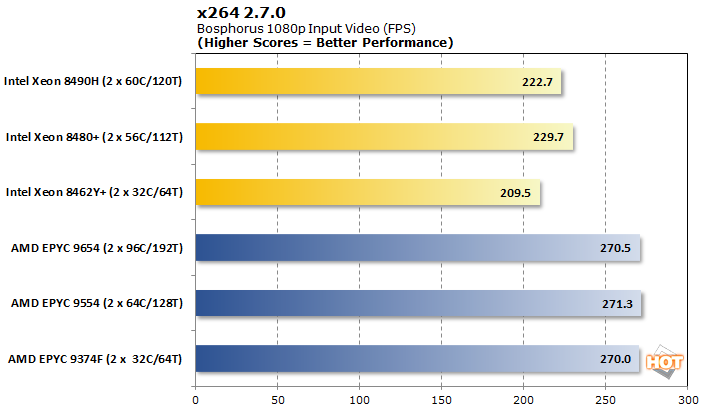
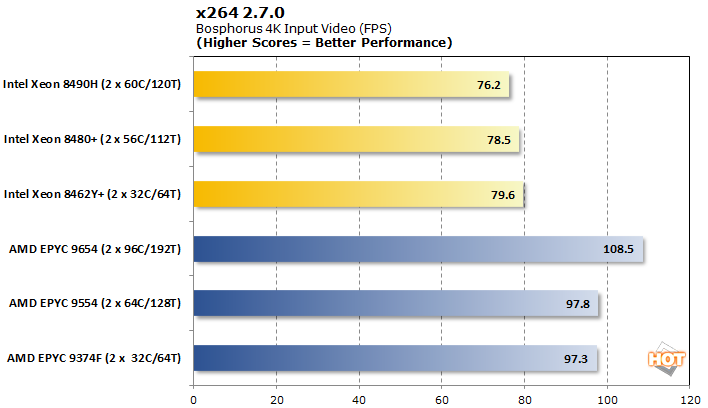
AMD retains a relatively narrow advantage in both 1080p and 4K encode paths. This time, there’s no real scaling to speak of from either camp, at least not in any way that would compel a customer to move up the stack.
PostgreSQL PGBench 1.13.0 Database Transaction Benchmark
PostgreSQL is very popular and provides us with a look at database processing performance. PGBench provides a rating of database transactions per second and corresponding average latency using both read-only and read-write workloads.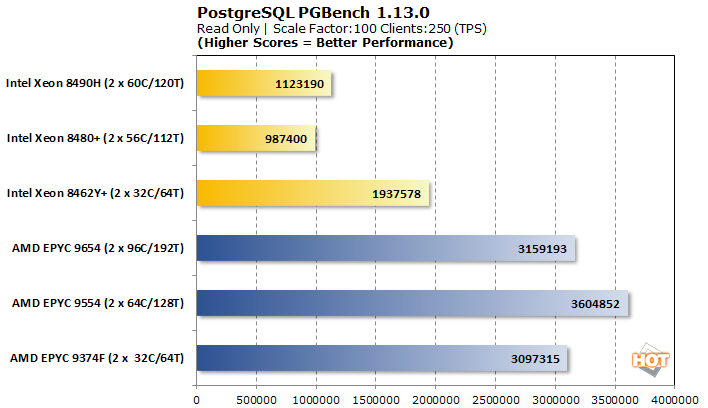
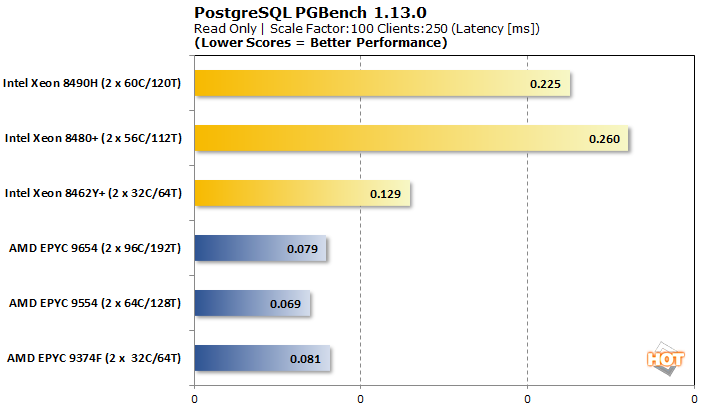
The difference in performance between camps is in a word, stark. In the read-only workload, only Intel’s 32-core Xeon 8462Y+ puts up any kind of fight. Even still, it only processes just over half as many transactions per second as any of the AMD chips. Its latency is also nearly doubled, but the Xeon 8480+ and 8490H really fall behind here.
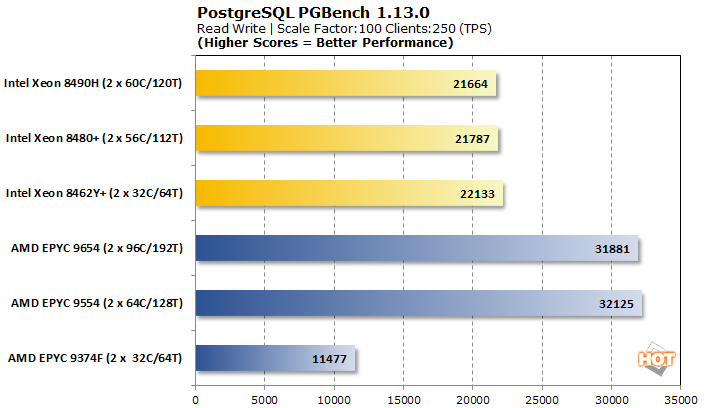
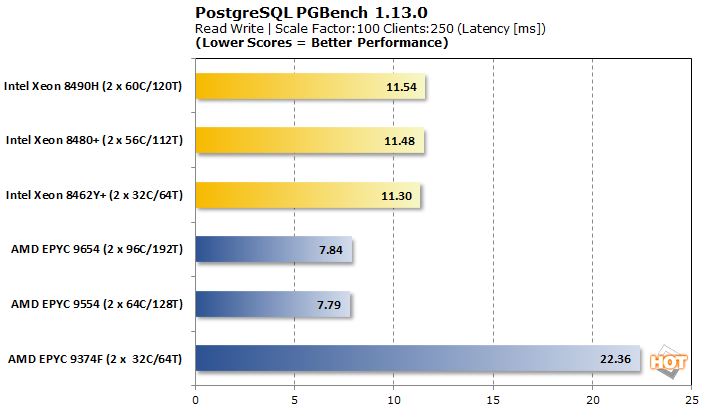
When writes enter the equation, Intel does fare better. AMD’s top SKUs are still about 45% faster though. As we saw in our original AMD Genoa review, the EPYC 9374F struggles to keep pace here and is probably best avoided for PostgreSQL workloads in general as there are simply better options.
POV-Ray 1.2.1 Ray Traced Rendering
POV-Ray, or the Persistence of Vision Ray-Tracer, is an open-source tool for creating realistically lit images. The Phoronix Test Suite implementation measures in time to complete, rather than the pixels-per-second we typically report in other reviews.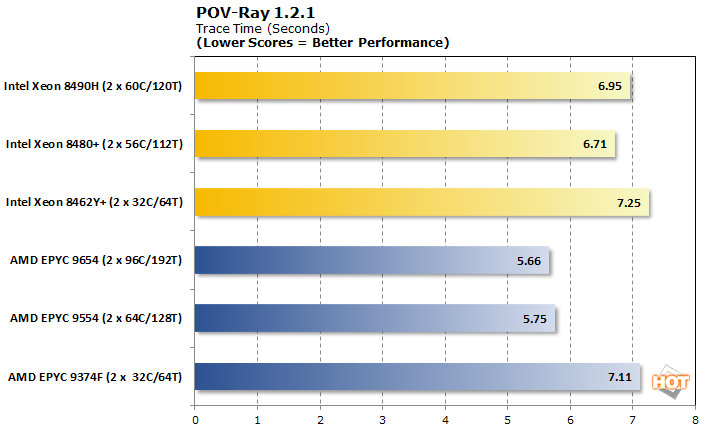
These POV-Ray results are surprisingly competitive, given the deltas we’ve observed in other workloads. The 32-core CPUs are neck-and-neck, and while the EPYC 9554 is a step ahead of the Xeon 8490H and 8480+, it isn’t by a whole lot, either.
Before we can really draw any conclusions, though, it is only fair to examine a few more potentially accelerated workloads to see where these Xeons really shine…


