Lenovo ThinkPad T470s Review: A Slim And Nimble Workhorse
ThinkPad T470s Benchmarks: SunSpider, Cinebench And PCMark 8
Our first batch of benchmarks is a mix of performance metrics. SunSpider is more of a platform / browser Javascript performance test and will vary from one browser to the next. We use the Microsoft Edge browse for consistency, though it resulted in some relatively poor performance with this machine for some reason (scores in Chrome were in-line with similarly equipped machines).
|
Unlike many widely available JavaScript benchmarks, this test is real-world with actual developer applications, balanced with different areas of the language and different code types and statistically sound, running each test multiple times to determine and average with error range and 95% confidence interval.
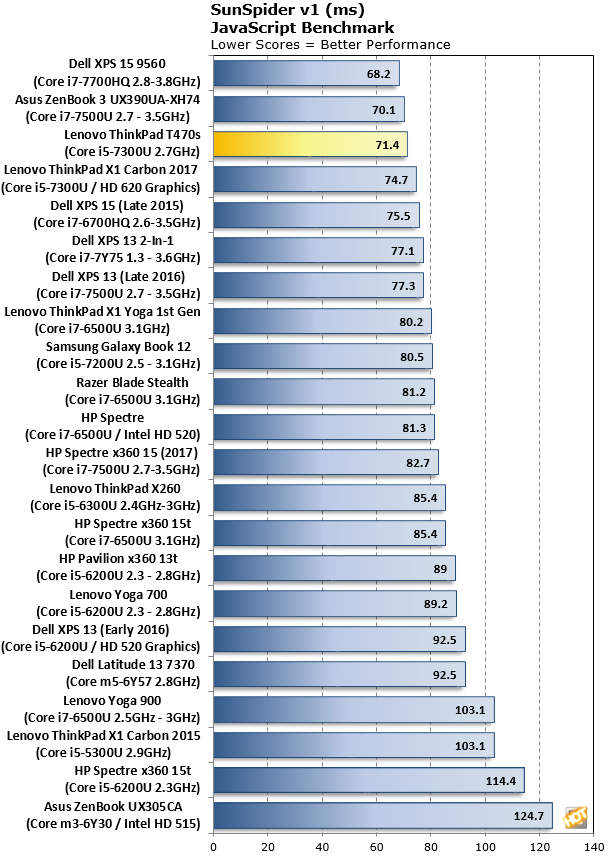
As you can see, this is one metric where the ThinkPad T470s shines. It's not equipped with the most powerful CPU but with the combination of its system components (CPU, SSD and memory) it manages an impressive 3rd place showing. This is an early indicator that light duty workloads like web browsing will be met with nimble responsiveness.
|
PCMark 8 v2 is the latest version in Futuremark’s series of popular PC benchmarking tools. It is designed to test the performance of all types of systems, from tablets to notebooks and desktops. PCMark 8 offers five separate benchmark tests to help consumers find devices that offer the perfect combination of efficiency and performance for their particular use case. This latest version of the suite improves the Home, Creative and Work benchmarks with new tests using popular open source applications for image processing, video editing and spreadsheets. A wide variety of workloads have also been added to the Work benchmark to better reflect the way PCs are used in enterprise environments. Though this is technically a "synthetic" benchmark, PCMark's trace-based workloads utilize real-world software and performance measurements.
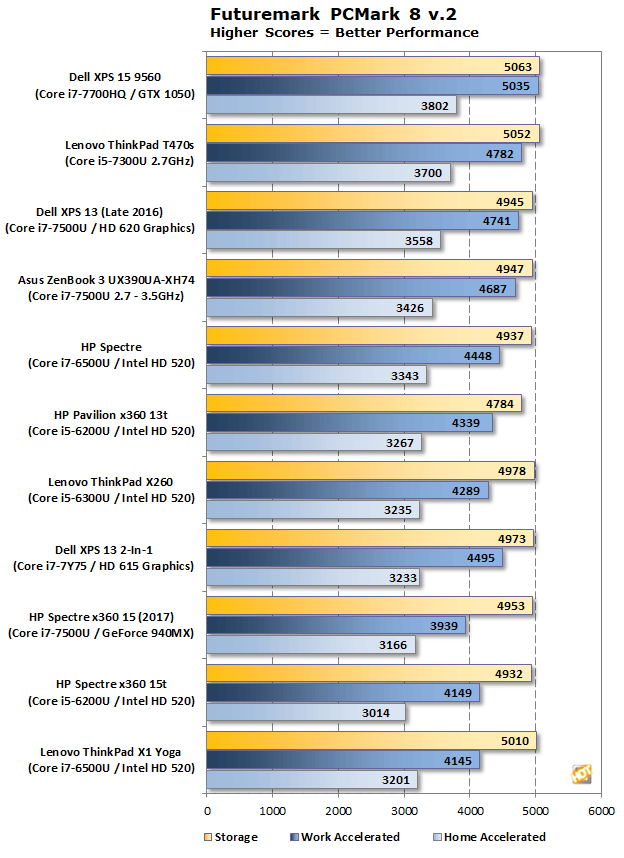
The PCMark 8 measurement was a great showing for this mainstream ThinkPad. It outperformed two Core i7-7500-based machines and only fell a hair short of the Dell XPS 15 9560, which has a much more powerful processor and GPU. This test tends to be storage sensitive and thus perhaps how the T470s squeaks out so many victories.
|
Cinebench R11.5 is a 3D rendering performance test based on Cinema 4D from Maxon. Cinema 4D is a 3D rendering and animation suite used by animation houses and producers like Sony Animation and many others. It's very demanding of processor resources and is an excellent gauge of computational throughput. This is a multi-threaded, multi-processor aware benchmark that renders a photorealistic 3D scene (from the viral "No Keyframes" animation by AixSponza). This scene makes use of various algorithms to stress all available processor cores. The rate at which each test system was able to render the entire scene is represented in the graph below, along with results from Cinebench's built-in OpenGL graphics benchmark.

As for Cinebench, the CPU benchmark was respectable, while the OpenGL performance was more middle of the pack. In terms of general graphics throughput the T470s is no workstation machine but it will handle most mainstream content creation workloads just fine.


