Before running our suite of benchmarks, we applied the latest Windows software and driver updates to the
ThinkPad X1 Extreme. Other than that, we didn't change any settings, including power profiles. We always want to test the system as it ships, but with the latest updates to accurately reflect what buyers can expect from an out-of-box experience. Our benchmarking kicks off with storage, CPU, and GPU tests to get an idea how the Extreme performs in day-to-day tasks.
 |
|
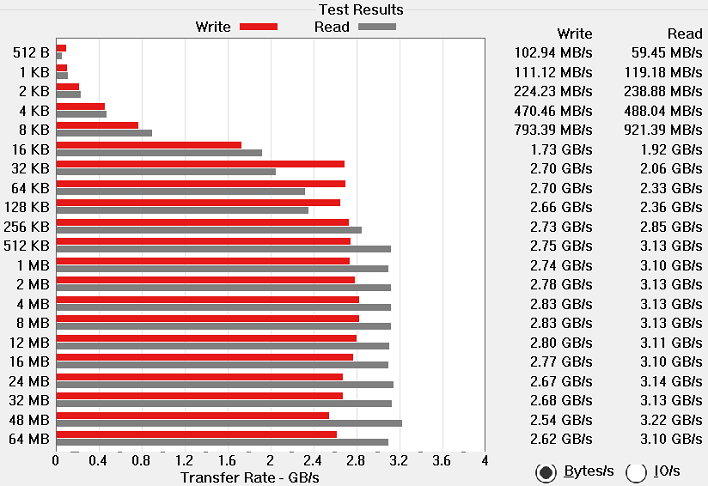
ATTO Disk Benchmark |
|
Peak Sequential Storage Throughput |
|
Our ThinkPad X1 Extreme ships with a Samsung P981a NVMe SSD. This drive gets four lanes of PCI-Express 3.0 connectivity and has a rated maximum read and write speed of 3 GB per second. In short, it should be pretty darn fast.
ATTO gives us a chance to gauge just how fast this drive is.
As expected, the ThinkPad X1 Extreme's
SSD performs (pardon the wordplay)
extremely well. Performance scales as the block size increases, and the drive easily eclipses 3 GB per second reads once it hits 512 KB chunks of data. Writes are similarly impressive with sustained speeds up over 2.5 GB per second. Boot times are similarly quick, as going from power on to the desktop only takes around 12 seconds.
 |
|
Speedometer Web Application Benchmark |
| Browser Performance |
|
To test browser performance, we use
BrowserBench.org's Speedometer test, which looks at web application performance. This test automatically loads and runs several sample webapps from ToDoMVC.com using the most popular web development frameworks around, including React, Angular, Ember.js, and even vanilla JavaScript. This test is a better example of how systems cope with real web applications, as opposed to a pure JavaScript compute test like JetStream. All tests were performed using the latest version of Chrome, which is up to 77 as of the time of this writing.
The ThinkPad X1 Extreme turns in a pretty quick performance in this browser benchmark built on real web application performance. While the Lenovo system doesn't completely dominate the field, it finds itself within just a few percentage points of the 2019 Dell XPS 15, which has a maximum turbo boost and core count advantage, and it's just a tick behind the
Dell XPS 13 2-in-1 with a 10th generation Ice Lake CPU. Performance in this benchmark is right about where we'd expect it to be.
|
|
Cinebench R15 and R20 |
| 3D Rendering Performance |
|
Cinebench R15 is a 3D rendering benchmark that tests both the CPU and GPU engines in the processor. Cinebench is developed by
Maxon, which is better known for its Cinema 4D software employed in professional 3D rendering and animation studios. We use both of Cinebench’s integrated tests for CPU and GPU.
The ThinkPad X1 Extreme turned in a stellar performance in Cinebench's CPU test, turning in a result around 40% higher than the XPS 13, and only around 23% slower than the
2019 Dell XPS 15 and its Core i9-9980HK's eight-core CPU. The OpenGL results were similarly impressive, only bested by the XPS 15, which has the same GPU but without the Max-Q power constraint. When we consider the fact that the XPS is also around 20% heavier than the ThinkPad X1 Extreme, the
Lenovo system shows a nice mix of portability and performance.
The latest version of Maxon's rendering benchmark,
Cinebench R20, takes longer to complete, so this is a better test of the XPS 15's cooling system. This release also drops the OpenGL test, making Cinebench a pure CPU test this time. We tested both single-threaded and multi-threaded performance.
Once again, the ThinkPad X1 Extreme slots in right where we'd expect it. The system's six-core CPU slots it in around half way between the fastest quad-core system on the charts and the eight-core behemoth at the top. The Extreme's 1T performance is equally impressive, as the Extreme turns in the highest single core result in our entire test set by the slimmest of margins.
|
|
Geekbench 4 |
|
Single and Multi-Core Performance |
|
Geekbench 4 is a cross-platform benchmark that simulates real world processing workloads in image processing and particle physics scenarios. We tested the machines represented here with Geekbench's single and multi-core test workloads.
Geekbench's multi-core test obviously benefits from then two extra cores and four extra hardware threads over most of its competition, as once again it only trails the XPS 15. Single core performance is equally impressive, as the Lenovo system turns in roughly the same single-core performance as the Dell system, and just about catches the 10-nanometer
Intel CPU in the smaller XPS 13. Suffice it to say, having all those extra cores doesn't come at the expense of single-thread performance.
|
|
PCMark 10 |
|
Productivity and System-Level Benchmarking |
|
PCMark 10 uses a mix of real-world applications and simulated workloads to establish how well a given system performs productivity tasks, including image and video editing, web browsing, and Office document editing. While these scores appear to be all over the place, the systems are sorted by their overall PCMark score, which is the third (gray) bar in each cluster.
Lenovo's ThinkPad X1 Extreme turned in a nice showing in
PCMark, coming in third overall. The system did especially well in the Essentials and Productivity benchmarks, thanks to excellent single-core performance and enough cores to multitask effectively. It also did pretty well in the Digital Content Creation test, but came in behind both the
Vega M and the XPS 15 in this graphics-heavy benchmark. Overall, the Extreme placed third among all of our business-class contenders, a nice showing all things considered.
Next up let's take a look at graphics and gaming tests.